


Undergraduate Housing Report 2024-25
Exploring Temperaments and Trends
Introduction & Objectives
In recent California political discourse, housing and perceived housing issues have taken center stage. California has the highest median rent (Time Magazine) and the highest unhoused population (Cal Matters) in the United States. As such, Governor Gavin Newsome has set a lofty statewide production goal of building 2.5 million new units by the end of the decade (Cal Matters). These issues affect the state’s population as a whole, and disproportionately affect areas with compounding social disadvantage. Consequently, housing insecurity and increasing rent prices affect the Undergraduate students of the University of California in complex, ever changing ways.
As of 2025, UC Davis guarantees housing for incoming fall-quarter freshmen and transfer students, as well as second year transfer students on certain conditions. However, undergraduate students who do not meet these criteria may have to look to off-campus housing options. The City of Davis, California has a population of 66,000 people, about half of whom are university students and faculty (UC Davis CPE). Because college students make up such a large fraction of Davis’s population, there is a high amount of rental turnover in the city. Over 9,000 new students enroll in the University annually, and 86% of them will graduate within six years (Aggie Metrics).
These compounding factors make the Davis housing market unique and potentially difficult to navigate. As such, The Innovation and Research Lab (IRL), alongside ASUCD Housing Advising for Undergraduate Students (HAUS), published a survey and compiled a comprehensive report to improve housing literacy among undergraduates, explore dimensions of student housing inequality, and document student feedback on the Davis housing market. As IRL has carried out similar projects surrounding the UC Davis Undergraduate experience with the housing market, IRL aimed to make these results comparable and contrastable with previous work. The interactive Tableau dashboard for the 2023-2024 Housing Survey can be accessed on Tableau Public.
Project Objectives
The primary objective of this project is to provide recommendations to HAUS through analyzing off-campus market trends and documenting student opinions. Additionally, this project will study what dimensions of housing and the housing experience make students feel that their housing is worth the cost, while also focusing on the experience of students who have experienced housing insecurity. In this iteration of the housing survey, the research also took focused interests in the quality of housing amenities and resource accessibility. Last year, IRL had only collected data concerning off-campus housing options, but this year the project’s scope expanded to monitor experiences among dorm students living as well.
Methodology
Housing Survey
The IRL/HAUS Housing Survey was developed on Qualtrics and consisted of 28 questions designed to collect numeric and descriptive data aimed towards addressing the aforementioned areas of interest. The survey was open for 87 days, from January 29th, 2025 to April 26th, 2025, and received 1,021 responses.
Specifically, the survey questions were tailored towards documenting trends and underlining intersectional inequalities in UC Davis’s undergraduate housing market to help advise HAUS’s practices moving forward. We asked questions to better understand the domains of rent costs, quality of life, crowding, maintenance issues, roommate relations, commute time to to campus, housing insecurity, and temperaments about housing costs. Additionally, the survey gathered qualitative free-response feedback to better attribute individual feelings to the documented quantitative results. Before publishing our survey, we consulted external researchers at IRL along with HAUS Unit Director Sam Hopwood to gauge the efficacy and effectiveness of our survey questions.
Survey Recruitment and Marketing
Various recruitment and advertising strategies were used to motivate individuals to participate in the survey. As an incentive, 300 randomly selected respondents were awarded $5.00 gift cards provided by the ASUCD Coffee House. Additionally, although not fulfilled by any respondent, another 50 Gift Cards to the ASUCD Coffee House were offered to the first 50 individuals to refer 10 people to the survey, again valued at $5.00. These incentives were advertised on various flyers posted both physically and virtually. QR Codes advertising and linking to the housing survey were displayed on the ASUCD Coffee House’s LCD screens incrementally throughout UCD’s Winter Quarter. Furthermore, over fifty mini-flyers were inserted into table tents pitched on various Coffee House Tables. Flyers were distributed and posted in locations such as the SILO, Teaching and Learning Complex, Wellman Hall, Young Hall, and Lower Freeborn’s KDVS radio station. While the survey was open, team members such as Hannah Wen, Dyson Smith, and Jeremy Elvander handed flyers out to groups of students around campus. The IRL Research team also tabled at the Cuarto Dining Commons on 2/20/25 and at HAUS’s Housing Fair on 4/16.
Great effort was put into distributing the housing survey virtually. Multiple social media accounts posted the virtual QR code linking to the qualtrics survey including the instagram accounts of IRL, HAUS, ASUCD, and ASUCD Executive office. Other student organizations, ASUCD Units, and student leaders at the University of California, Davis reposted the survey in effort to increase participation. These external contributions include but are not limited to: Gaius Ilupeju’s ASUCD President Account, Aaminah Mohamed’s ASUCD Vice President Account, Aggie House, the Housing and Transportation Advocacy Committee (HTAC), and the AI Student Collective (AISC). On 4/24/25, ASUCD President Gaius Ilupeju sent an email to the Undergraduate student body which contained an advertisement for the survey. With all these methods combined, IRL’s 2025 Housing Survey garnered 1,021 total responses, the highest among any previous project.
Data Processing/Methods of Analysis
To ensure data accuracy, survey respondents were omitted from analysis if their completeness of the survey was below 50% or if they finished the survey in less than 60 seconds. Additionally, duplicate responses that contained the same email from an optional respondent email request question for a gift card raffle were removed. After data cleaning, the final dataset consisted of 879 entries, compared to 308 observations in 2024.
Questions pertaining to rating housing features were conducted utilizing the 5-point Likert scale. For example, the available responses for a question that asked respondents to rate their satisfaction with their housing’s maintenance were “Very Dissatisfied”, “Dissatisfied”, “Neither”, Satisfied, and “Very Satisfied.” For certain analyses, these categories were transformed into numeric responses numbered 1 to 5. Continuous variables, such as the amount of rent an individual pays monthly, were binned into categories to make digestible visualizations and certain methods of categorical analysis applicable. These levels for the categorical rent variable were created by leveraging the quartiles of the rent responses while creating two additional levels for the lowest and highest deciles of rent payers. This was done to test if and how certain sensibilities vary at the extremities of rent paid among UC Davis undergraduates.
Other variables transformed for applicable data analysis include crowding and quality of life. To enumerate crowding per household, we took the question “Including yourself, how many people are living in your house/apartment?” and divided it by the question “How many bedrooms are in your house/apartment?” For the purpose of contingency testing, this variable was binned at 1 or less People Per Bedroom (PPB), 1 - 1.25 PPB, 1. - 1.5 PPB, and 2 or more PPB. Another important created variable was the Quality of Life metric (QOL). The QOL variable was created by parsing through respondents likert-scale answers within the following question matrix: “Rate the following regarding quality of life at your housing : Accessibility to nearest grocery store, Accessibility to nearest bus stop, Accessibility to entertainment, Maintenance / Management, Housemate / Roommate Relationships, Quietness, Safety, and Privacy.” For every dimension of quality of life that a respondent rated being “Satisfied” or “Very Satisfied,” one point was added to their quality of life score. This made the range for the QOL variable range from 1-8.
All data was cleaned, analyzed, and visualized using Excel, R, and Tableau. Multiple methods of analysis were used to accommodate the different types of data collected. Chi-Squared tests for association were used on multiple different categorical variables to determine independence. For example, one could use the categorical rent bins and “Is your housing worth the cost” to determine if rent paid is associated with temperaments about housing worth. Another method of categorical data analysis used was odds ratio testing for independence pertaining to the likelihood of having a triple bedroom configuration in the dorms versus outside of the dorms. One Logistic regression was performed with the binary outcome variable “Is your housing worth the cost” (Yes/No) regressed on the quality of life matrix to determine what factors outside of rent determine if housing is worth the cost among UC Davis undergraduates. Welch’s Paired t-test were also conducted to determine differences among individual and shared leases, and non-parametric permutation tests were used to test mean differences among the small sample size of students who have experienced housing insecurity. In all hypothesis testing, the alpha, or the level for rejecting the null hypothesis of independence/insignificance was set to be 0.05.
Findings
Sample Characteristics
Sample Characteristic #1
Among Survey Respondents, most either lived in an Apartment Complex (55.86%) or Dorms (32.18%). Pictured below is a bar chart documenting what type of housing survey respondents indicated that they live in.

Sample Characteristic #2
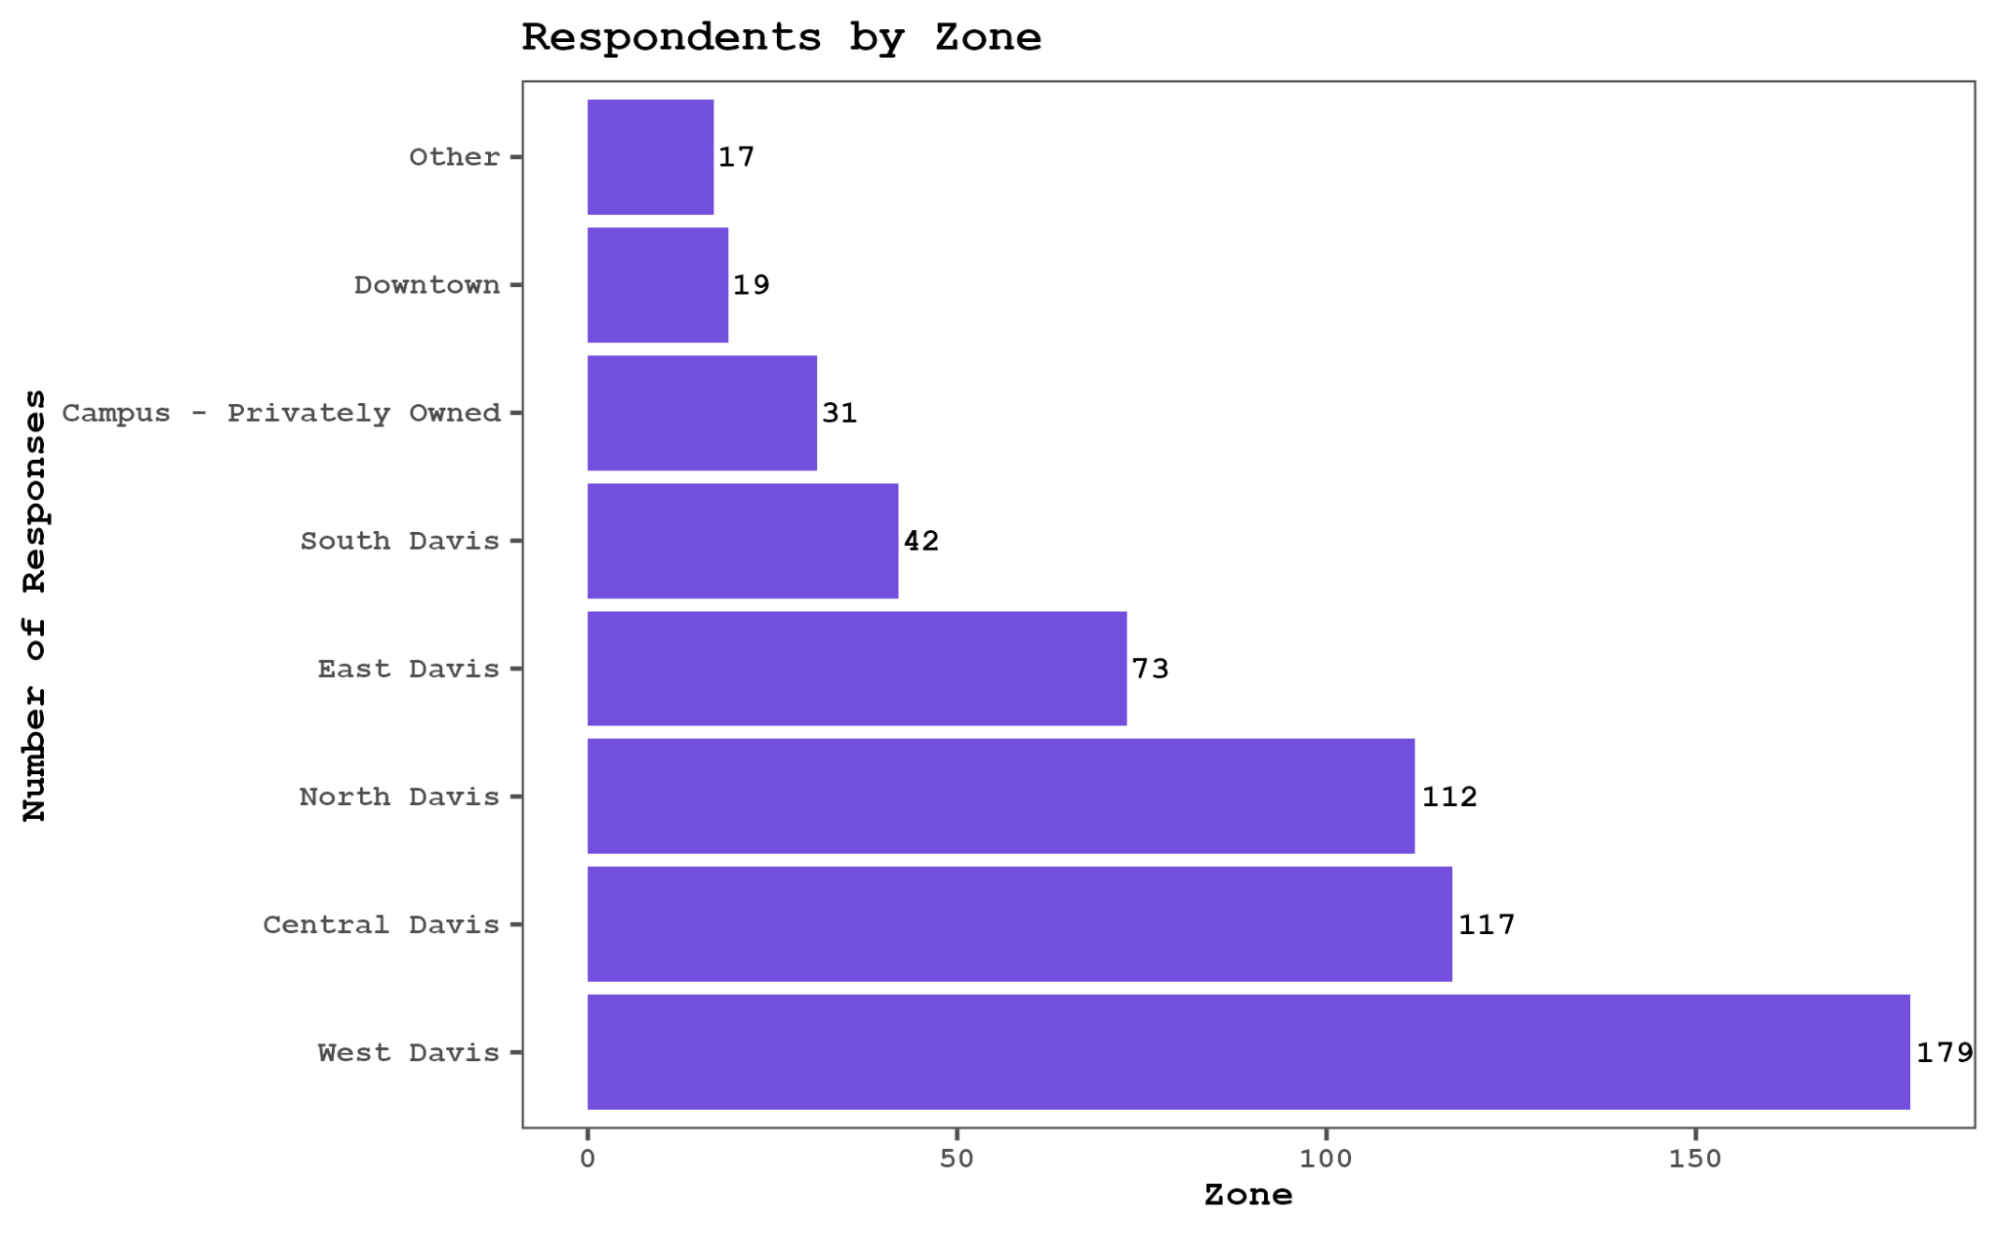
69.2% of respondents live in West, Central, or North Davis. 590 respondents who live off-campus reported which zone they live in. Approximately 30.3%, 19.8%, 119.0%, 12.4%, and 7.1% of respondents reported living in West, Central, North, East, and South Davis, respectively. 5.3% of respondents reported living on campus in a privately owned apartment or home. 2.9% of respondents reported living in a zone not listed. Out of these 17 respondents, 5 filled out the additional comment box saying they lived in Sacramento, Woodland, North Highlands, Elk Grove, and Stockton.
Sample Characteristic #3
Nearly a third of respondents are first years. Out of 870 respondents who reported their start year, approximately 32.2%, 27.6%, 23.6%, and 15.2% of respondents were 1st, 2nd, 3rd, and 4th years, respectively. 5th years, and 6th years and above made up only 1% and 0.3% of respondents.

Rent
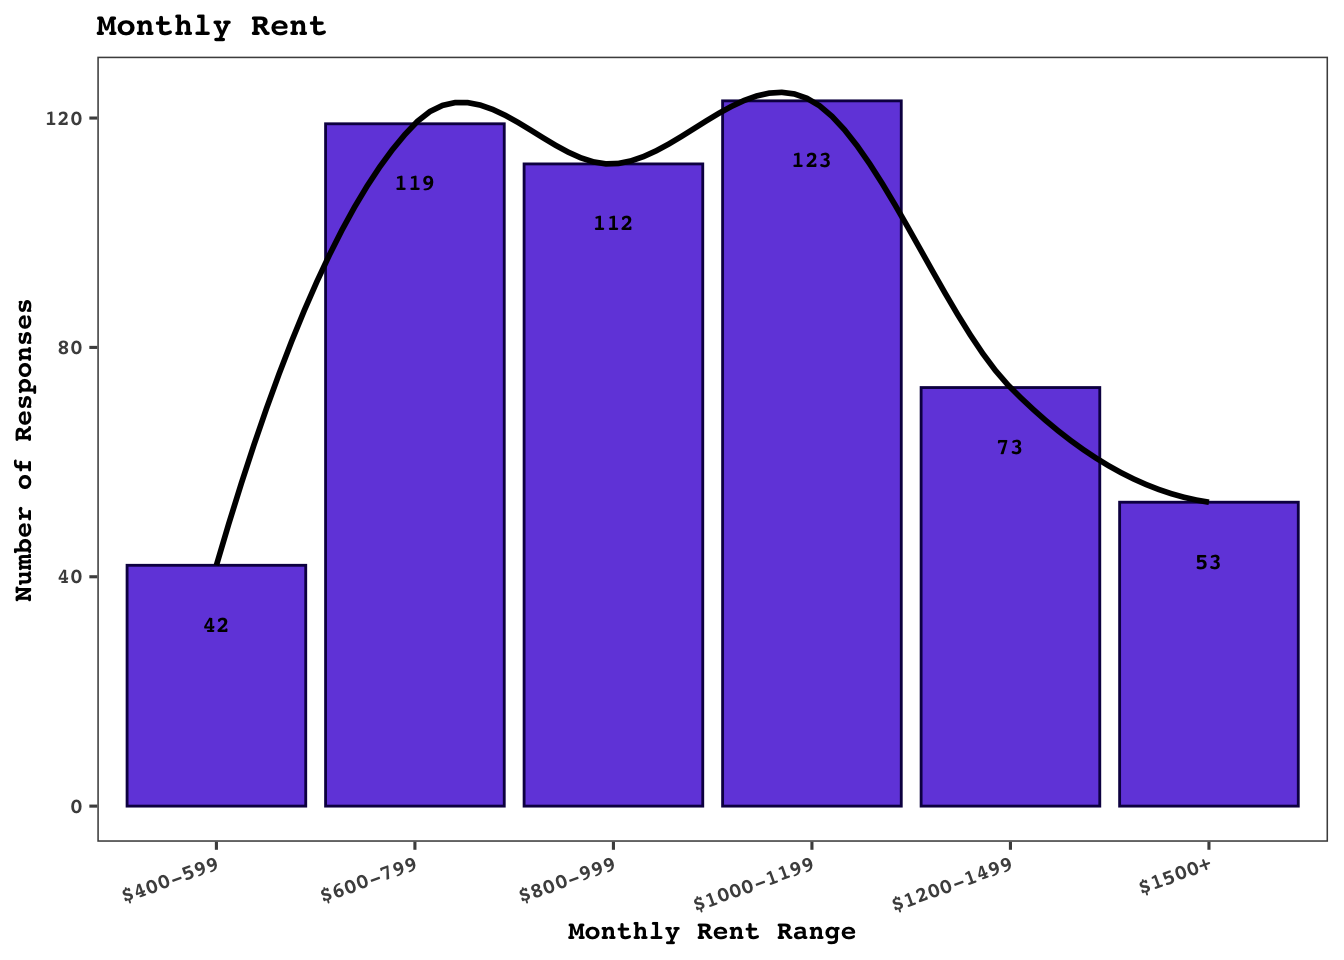
Rent Finding #1: The median rent paid among undergraduates students in Davis, California is $968. Most individuals pay anywhere from $600 - 1,200.
Pictured below is a histogram and box-plot documenting the amount of students who pay rent at certain thresholds, along with the quartiles and outliers among rent paying students.

Rent Finding #2: Rent depends greatly on bedroom configuration and number of housemates.
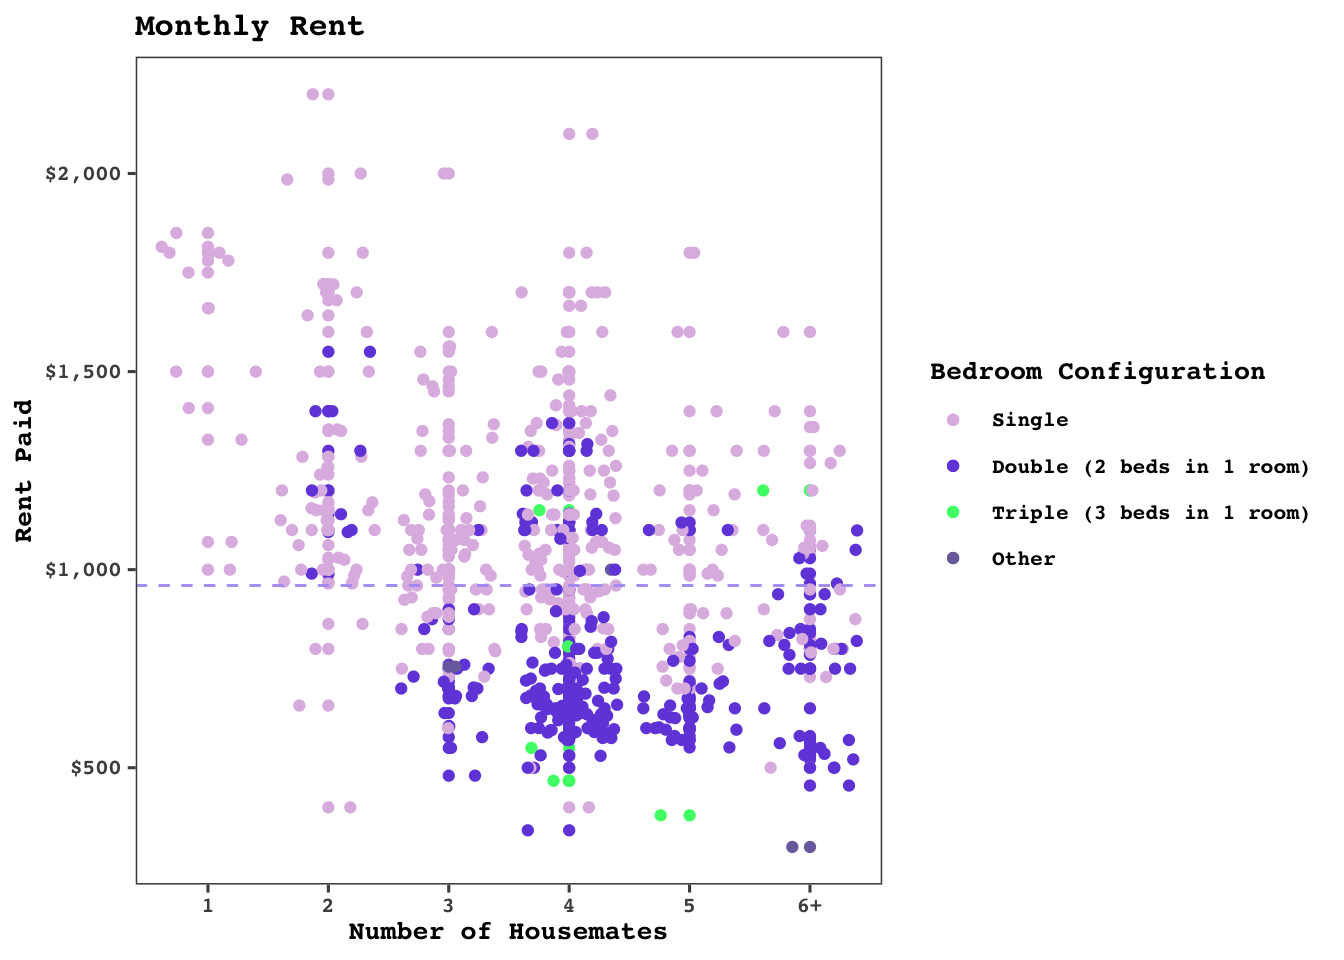
Findings demonstrate that the average monthly rent for those who had their own bedroom was $1,186.06. This was significantly higher than those who listed their bedroom configuration as a double, as those individuals paid $779.45 on average. Below is a scatterplot of rentpayers by the number of housemates that they reported in their house, followed by two histograms of rent among students who live in a single versus a double.


Rent Finding #3: Students who pay higher rent are more likely to feel that their housing is not worth the cost.
Rent was found to be associated with temperaments about whether student’s felt if their housing was worth the cost. This was determined by a Chi-Squared test that had a test-statistic (X2)of 59.37, which resulted in a p-value very close to zero.


Rent Finding #4: Rent for shared leases are less than rent for individual leases on average.
In a shared lease, all tenants in a housing arrangement are all jointly responsible for the entire rent sum. An independent lease has leases for each tenant, making a tenant responsible for only their share of rent. Out of 590 respondents who live off-campus, 254 (43.1%) had individual leases while 336 (56.9%) had shared leases.

The mean rent for single rooms on individual leases is approximately $341.03 more than single rooms on shared leases. The mean rent for double rooms on individual leases is approximately $193.78 more than double rooms on shared leases. The average rent prices for respondents on a shared lease are approximately 25.3% and 21.4% less than the average rent prices for respondents on an individual lease for single and double bedroom configurations, respectively.
Utilizing a Welch t-test, it is evident that this difference in rent is statistically significant. At a 1% confidence level, there is sufficient evidence to reject the hypothesis that the average rent for a single bedroom configuration is the same for individual and shared leases. At a 5% confidence level, there is sufficient evidence to reject the hypothesis that the average rent for a double bedroom configuration is the same for individual and shared leases.
Quality of Life
Finding #1: Students feel a greater sense of privacy in off-campus housing than dorm housing
As many other results from this analysis reaffirmed, students in dormitories tended to be more unsatisfied with many dimensions of their housing. This difference was observed in the sphere of privacy as well, where on the 5-point likert scale respondents students living in off-campus dorms reported an almost half point advantage in their feelings of privacy. As this finding is denoted across hundreds of respondents and is scaled across only five points, this difference carries a high magnitude and was statistically significant in an unpaired t-test, with a p-value close to zero.

Finding #2: The quality of life dimensions most correlated with an individual feeling that their housing was worth the cost were as follows: Privacy, Experience with Maintenance, Access to Entertainment, Access to Grocery Stores, and Roommate Relationships.
In a multivariable logistic regression, we found that for the five aforementioned variables, point increases on the five point likert scale had a statistically significant relationship with the feeling housing was worth the cost at atleast 𝛼 = 0.05. Upon exponentiating the regression coefficients back into odds-ratios, we found that a one point increase in an individual’s Likert scale increased their odds of feeling that their housing was worth the cost by 39.51% (Privacy), 38.97% (Maintenance), 29.82% (Entertainment), 24.36% (Grocery Store), and 17.82% (Roomate Relations) respectively.

Finding #3: Students who reported higher quality of life more often felt that their housing was worth the cost.
The more quality of life questions that students answered “Very Satisfied” or “Satisfied” on, the higher likelihood they felt their housing was worth the cost. This can be visualized in the scatter plot below, as further right along the y-axis displays more purple dots, representing the individuals who felt that their housing was worth the cost. However, this relationship is nuanced by price, and this plot serves as a good reminder that the dimensions that affect how an individual feels about their housing are not mutually exclusive, and can interfere with each other. The horizontal asymptote represents the median rent paid in Davis, while the vertical asymptote represents the median (6) reported quality of life, as it pertains to housing, among surveyed undergraduate students.

Maintenance
Finding #1: Most prevalent maintenance issues differ among students in dormitories compared to students living off campus.
Out of 857 respondents who responded to questions asking them about their experience with housing issues and worth, 312 (36.4%) respondents reported experiencing management or maintenance issues. These respondents were then given a multi-select question asking them which types of issues they faced.
For students off-campus, the most common issues were broken appliances, plumbing, mold, and lighting/electricity issues which were selected by 46.7%, 38.5%, 33.7%, and 33.8%, of the respondents, respectively.

For students in the dorms, the most common issues were AC/heating, broken appliances, and lighting/electricity issues which were selected by 48.9%, 29.1%, and 24.2% of respondents, respectively.
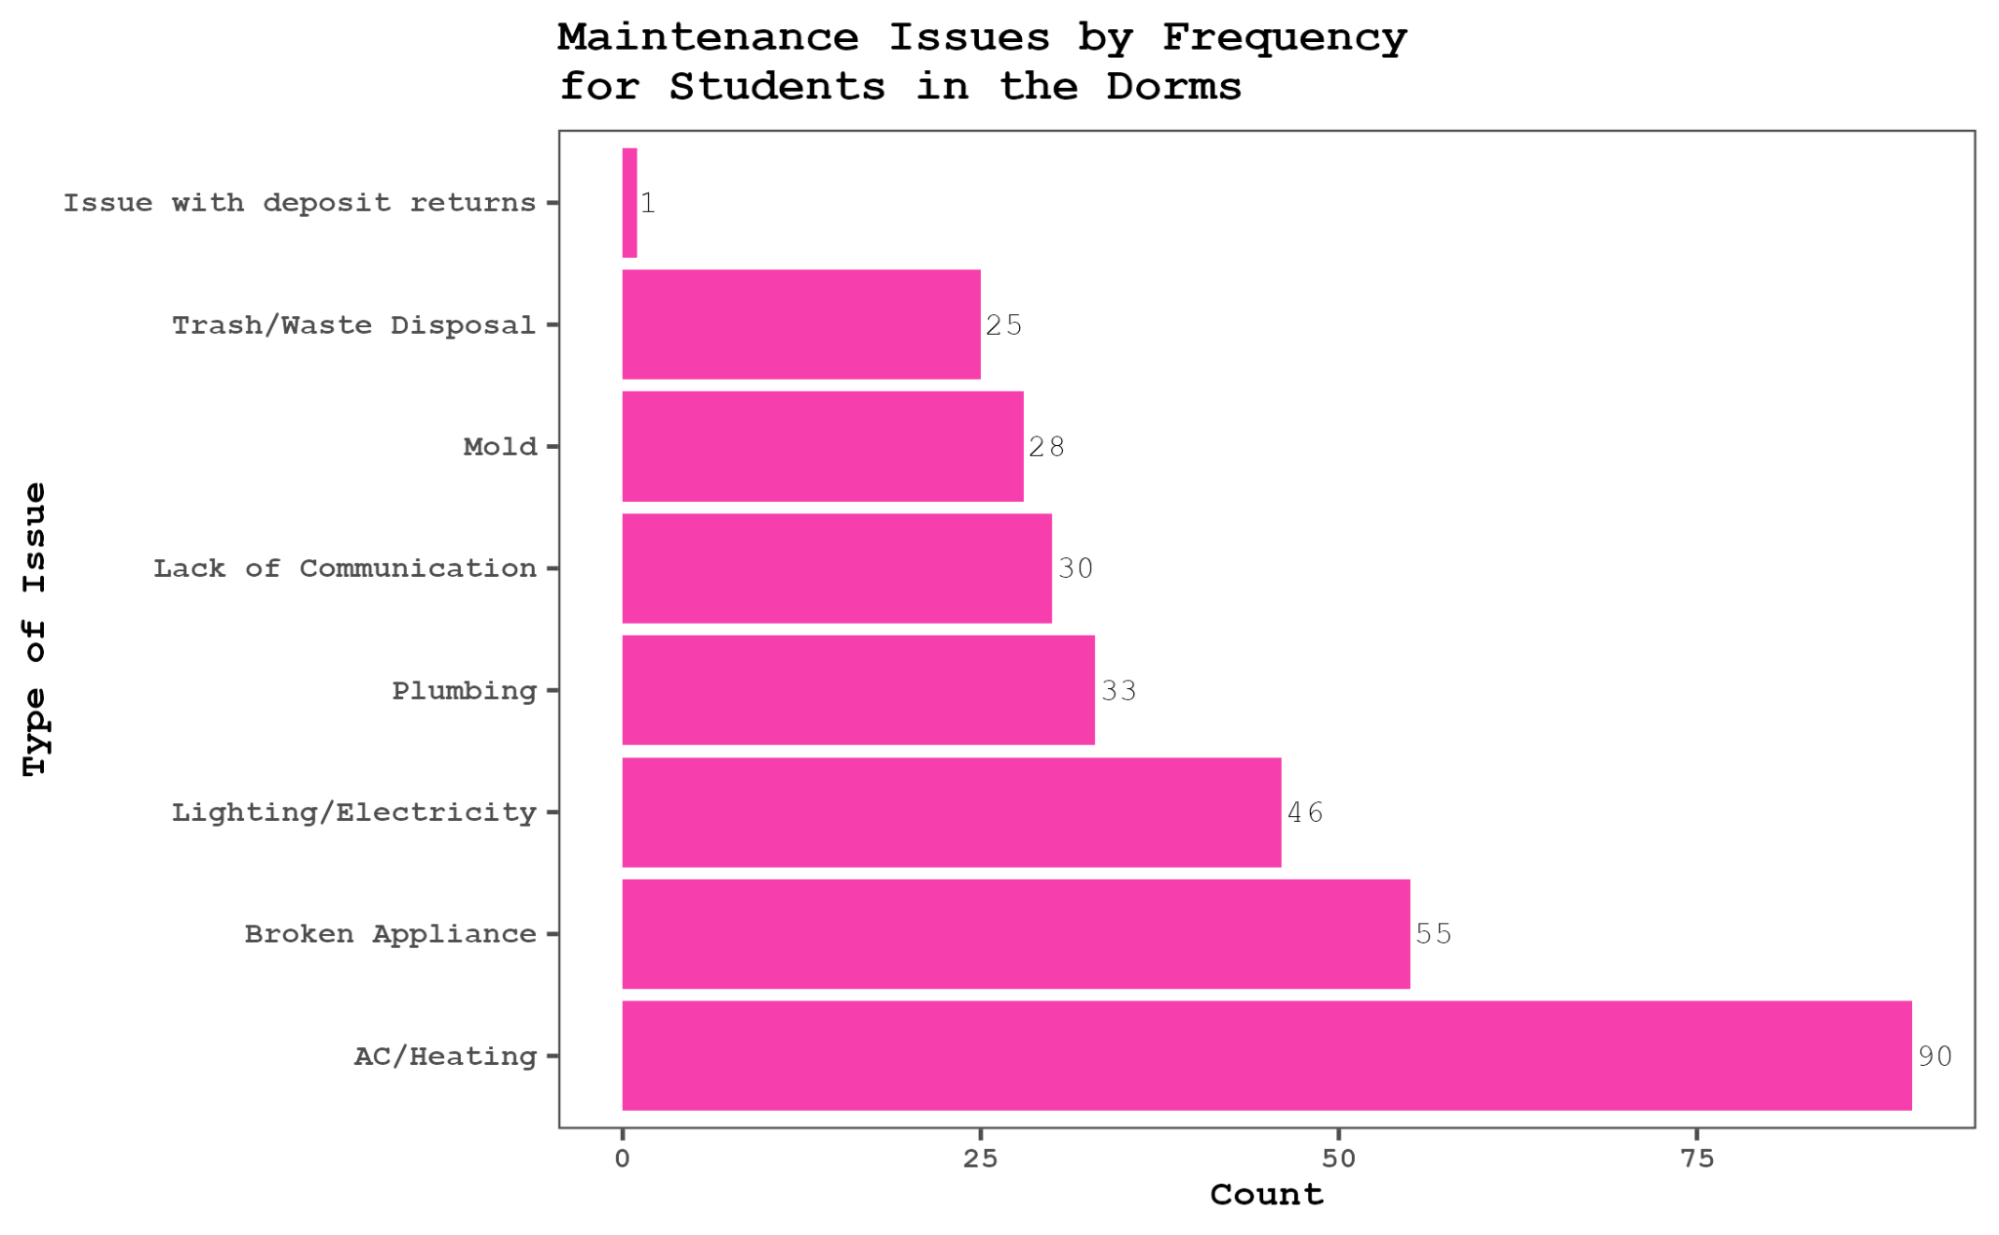
Broken appliances and lighting/electricity issues are common among both students on and off campus, but at different rates. It appears that a lower proportion of students in the dorms experienced issues than the percent of students off campus, except for AC/heating. AC and heating issues are reported for nearly half of respondents on campus, while all other issues are reported at rates of ⅓ or less. It is observed that students off-campus experience a greater range and combination of issues, while students on-campus face the same issue with AC/heating.
In the testimonial free response question, respondents commonly reported roach, rodent, and general pest issues. Additionally, a common complaint was that broken appliances were not being fixed soon enough. In the dorms, many respondents also reported plumbing and hot water issues in the bathrooms.
Finding #2: Higher proportion of students who have experienced management or maintenance issues feel that their housing is not worth the cost.
Out of the respondents who experienced maintenance or management issues, 162 (51.9%) felt that their housing was worth the cost. In comparison, out of the 545 respondents who have not experienced any issues, approximately 16.7% more respondents felt that their housing was worth the cost at 374 (68.6%) responses.
Performing a Chi-square test, it was found that the p-value is 0.000002135, approximately 0. This indicates that the relationship between experiencing management or maintenance issues and whether a respondent feels that their housing is worth the cost is statistically significant.

Crowding, Bedroom and Bathroom Configuration
Crowding, Bedroom, and Bathroom Configuration Finding #1: Houses provide a higher range of bedrooms.
560 respondents who live off-campus reported the number of bedrooms in their housing situations. 483 (86.3%) respondents live in apartment complexes and 77 (13.8%) live in houses. Over 90% of respondents in apartments or houses could be captured in a 2 room range. For apartments, 91.3% of respondents lived in an apartment with 2-4 bedrooms. For houses, approximately 93.6% of respondents lived in a house with 3-5+ bedrooms.

Crowding, Bedroom, and Bathroom Configuration Finding #2: UC Davis Undergraduates average anywhere from 1 to 1.67 people per bedroom.
The majority of off-campus, rent-paying respondents (n = 269) reported having as many bedrooms as people within their place of living. However, 117 individuals reported that there were 2 or more people per bedroom in their place of living, with the highest amount of reported individuals per bedroom being 3. The first quartile of respondents averaged out to 1 person per bedroom with the third quartile of responses averaging out to 1.67 people per bedroom. Pictured below is a histogram of categorized crowding numbers.

It is important to note that in a Chi-Squared test for association, Crowding was not found to have a statistically significant relationship with an individual feeling their housing to be worth the cost (X2 of 3.2113, p-value of 0.3602). This is a complicated finding, as one may think an individual in a more crowded living space may feel they are not getting good value for their investment. However, it is important to note that those who paid lower costs more often felt that their housing was worth the cost to a statistically significant magnitude, and those who live in more crowded units oftentimes pay lower costs. With this in mind, we hypothesize that a student’s relationship with feeling their housing is worth the cost may be more based on quality of life and cost itself than crowding or bedroom configuration. On the topic of crowding an arrangement, another noteworthy finding is that the average number of bathrooms per bedroom among UC Davis undergraduates is 0.7165. The lowest reported bathrooms per bedroom was 0.25 bathrooms per bedroom, while the highest was 2.
Crowding, Bedroom, and Bathroom Configuration Finding #3: Crowding goes down as rent goes up.
This finding is somewhat intuitive but still useful to see for UCD students considering their available options. As previously outlined, the amount of rent an individual pays is a determinant of many factors, such as their bedroom configuration, crowding within their household, and location. In terms of bedroom configuration, the average monthly rent for those living in a single was $1,186. For those who lived in a double (2 people one bedroom), the average monthly rent was $779. Below is a graph of crowding by rent paid. This histogram visualization gives a better idea about how many people an individual can plan to live with based on their desired rent that they want to pay, and desired bedroom configuration.

Crowding, Bedroom, and Bathroom Configuration Finding #4: Individuals in dorms are 152.23 times as likely to have a triple-bedroom configuration than off-campus students.
Only 8 off-campus survey respondents reported living in a Triple (Three people in one Bedroom). As Triple dormitories are very common, they make up almost all of the Triple Configurations experienced amongst UC Davis undergraduates. So much so that in an odds ratio calculation, students living in dormitories were found to have 152.23 times the odds of living in a triple compared to off-campus students. Visualized on the left is a bar graph of bedroom configurations amongst all survey respondents, then on the right is the bedroom configuration of all survey respondents minus those living in dormitories. As can be observed, almost all individuals who reported living in a triple were on-campus students.


Commute to Campus
Commute to campus finding #1: It takes most students 10 minutes or less to get to campus.
Among all survey respondents, 360 of them (41.37%) reported that it took them 10 minutes or less to get to campus. However, these results should be taken with a grain of salt, as a fair percentage (32.18%) of survey respondents lived in the on or near campus dormitories. 244 survey respondents (28.04%) reported it taking 10-15 minutes to campus, the second highest among the available categories, which are visualized below.

In a Chi-Squared test for association, commute time to campus was not found to have a statistically significant relationship with an individual feeling that their housing was worth the cost. However, and again somewhat intuitively, in a Chi-Squared test for Association, the Zone a student lived in was found to be associated with their estimated commute time to campus. The zones of Downtown and Central Davis reported the shortest commute time, while residents of South Davis reported the longest commute times, with the mode of the histogram being in the 15-20 minute bin (n= 15).
Another noteworthy finding was that the amount of rent an individual paid was not also not found to have a statistically significant Chi-Squared Association with an individual's commute time to campus (X2 of 16.069, p-value of 0.3775, df = 15). This result suggests that rent can vary by location, but is more determined by factors such as crowding and bedroom configuration.
Commute to campus finding #2: The most popular method of commuting to the UCD campus is biking.
When students were asked to rank their most frequented transportation type, the first preference emerged to be Biking (n = 372), followed by Driving (n = 181), taking the bus (n= 166), and lastly walking (n = 151). Also asked of survey respondents, the most popular bus line taken to campus was found to be the J line (n = 76), followed by the G (n = 62), K (n = 53), and C (n = 52) lines.
Housing Insecurity & Financial Aid
Housing, Insecurity & Financial Aid Finding #1: Approximately 9.12% of Undergraduate students at the University of California, Davis, have experienced housing insecurity in the past year.
78 out of 856 survey respondents reported having faced housing insecurity in the past year. Among these previously or currently housing insecure respondents, only 27 of them reported (34.6%) knowing “To a Great Extent” or “Somewhat “ about HAUS. This was even lower for other resources/organizations, as only 14 respondents (17.95%) reported having this level of knowledge about HTAC, Aggie House, and Community Housing Day (%), while only 7 of these respondents (8.97%) had this level of knowledge for the Community Housing Listing. These findings reflect that those who have experienced housing insecurity in the past year are an underserved population who aren’t being given the information to access resources made available to them.
Housing, Insecurity & Financial Aid Finding #2: Approximately 9.12% of Undergraduate students at the University of California, Davis, have experienced housing insecurity in the past year
In a permutation test computed by the difference of group medians, it was found that students who had experienced housing insecurity in the past year pay less rent on average than those who hadn’t. In the 2,000 simulated permutations, none found a larger difference than the actual difference between the median of rent paid among students who hadn’t experienced housing insecurity versus those who had, resulting in a p-value of 0. Similarly in a permutation test computed by the difference of group means, our results suggested that students who have experienced housing insecurity in the past year reported lower quality of life. Again after 2,000 simulations, no simulated difference of means between random groups was higher than the actual difference, resulting in a p-value of 0.
Knowledge of Resources & Miscellaneous Findings
Finding #1: Students in dormitories are more interested in expanding co-op living.
Out of 842 respondents to this question, 269 (31.9%) respondents reside in dormitories while 573 (68.1%) respondents live off-campus. For respondents in the dorms, 138 (51.3%) students selected that they would be interested in expanding co-op living such as the Domes. For respondents off campus, 258 (45.0%) students selected that they would be interested, approximately 6% less than the proportion of students living on campus.

Finding #2: Many students know very little to nothing about several UC Davis Housing Resources.
Out of the 879 respondents to the resource awareness question, at least half of respondents knew very little to nothing about each resource listed except for Aggie Compass. Aggie Compass and Housing Day had the highest proportion of respondents being somewhat or very aware of them at 54.7% and 36.3%, respectively.
Below is a table noting the % of respondents who were not at all, very little, somewhat aware, or to a great extent aware of several UC Davis housing resources.

Finding #3: Respondents still overwhelmingly agree that UC Davis should provide more housing information.
Out of 846 respondents to this question, 730 (86.3%) either agreed or strongly agreed with the statement that UC Davis should provide more housing information. In the 2024 Housing Report, out of 282 respondents, 256 (90.8%) respondents agreed or strongly agreed that UC Davis should provide more housing information.

Finding #4: Start year at UC Davis was associated with temperaments about housing worth.
In a Chi-Squared test for association, the variables of Start year at UC Davis and feeling that housing is worth the cost were associated to a statistically significant degree (X2 of 10.578, p-value of 0.01424, df = 3). As can be seen in the bar chart below, students who started in 2024 reported higher levels of dissatisfaction with the worth of their ho=using, potentially reflecting dissatisfaction among students living in the dorms. Additionally these findings could be the result of time in the market, with the theory that the longer a student has knowledge of the housing market, the more likely they will be to find equitable housing.


Conclusion & Discussion/Recommendations
In conclusion, the perception of housing worth was correlated with maintenance issues, quality of life, and housing cost. While all of these factors are expected to be responsible for whether a student believes their housing is worth it or not, they are influential to varying degrees. The prevalence of maintenance issues demonstrated a significant decrease in the proportion of respondents who felt their housing is worth it compared to those who did not experience maintenance issues. Additionally, nearly half of the 1st year respondents believe that their housing is not worth the cost, which may be related to the precedence of AC/heating issues reported amongst that population.
In the 2024 housing survey, 90.8% of respondents agreed or strongly agreed with the statement that UC Davis should provide more housing information. Additionally, when respondents were asked if they would use a housing booklet provided by ASUCD, 76.2% of respondents selected yes. This year, 86.3% of respondents agreed or strongly agreed with the statement that UC Davis should provide more housing information. While respondents were not asked whether they would use a housing booklet in the 2025 survey, there is still an overwhelming sentiment that undergraduate students want to be more informed on housing.
There are several different factors that contribute to determining rent. Our findings demonstrated significant evidence that an apartment/house being on a shared or individual lease is related to significant differences in rent. Additionally, rent is also heavily dependent and differentiated on single and double occupancy bedroom configurations, demonstrating differences in pricing and the distribution of rent.
In general, many respondents are unaware of the student housing resources, yet believe that UC Davis should provide more housing information, indicating a gap between the implementing these resources and students using them.
- Creative accessible privacy methods for dorm students and maintenance. While it is difficult to implement fixes to issues that are so broad such as privacy and AC/heating systems, it is important to acknowledge that maintenance issues play a big role in a respondent’s perception of whether they view their housing as worth it. Advocating for structural improvements such as improved central air conditioning systems or smaller issues such as more timely maintenance in the bathrooms can improve the perception of the dorm experience. Creating equitable access/infrastructure to support items such as curtain partitions and dividers could go a long way for the privacy among dorm students.
- Further push the University’s available housing resources physically and digitally targeting specific issues such as tenant rights. ASUCD HAUS has provided a variety of housing resources, including information on helping students exercise their tenant rights. However, despite respondents’ dissatisfaction with their housing management and maintenance, many were unaware of resources available such as ASUCD HAUS and HTAC. The resources that were more well known among respondents were Housing Day and Aggie Compass, which have large physical presences on campus. Therefore, we recommend that housing resources should be advertised and tabled for on campus, specifically at larger events or with incentives for students to learn more. Additionally, while social media efforts are already implemented, we recommend making targeted posts oriented around helping students know their options and rights when it comes to management and maintenance issues. ASUCD should also work to find direct avenues to target students who come from socially disadvantaged backgrounds who may be predisposed to housing security.
- Make efforts towards creating a centralized informational platform/booklet about undergraduate student housing. Target students with summary information moving out of the dorms (first year and transfer students). Over 80% of respondents have either agreed or strongly agreed with the idea that UC Davis should provide more housing information for both the 2024 and 2025 housing survey. UC Davis used to provide physical guides on both on and off campus housing for students. Reviving this handbook and publicly digitizing it can greatly help the UC Davis student body. With the information from the housing survey, several statistics such as mean rent or number of bedrooms can help students better understand their options as renters.
Appendix
Appendix A: Survey Questions
Survey Prerequisites
- By completing this survey, you acknowledge and consent to the use of your responses for research purposes. All collected information will remain confidential and will not be shared outside of the ASUCD Innovation and Research Lab unless specified otherwise. Your data will be securely stored and used to inform our Mobile Pantry operations. You are free to withdraw from the survey at any time without penalty. If you have any questions about the survey or the use of your data, please contact [email protected].
- Checkbox to approve consent
- Are you an undergraduate student?
- Yes
- No
Survey Questions
- What year did you start at UC Davis?
- Before 2020
- 2021
- 2022
- 2023
- 2024
- What type of housing do you live in?
- Dorms (Segundo, Tercero, and Cuarto)
- Apartment complex
- House
- Social housing (Greek life, co-ops, sports)
- Other: [Text entry]
- Which Davis zone do you live in? Refer to the image for specifications.
- Central Davis
- North Davis
- East Davis
- South Davis
- West Davis
- Downtown
- Campus (privately owned housing)
- Other: [Text entry]
- [If 2b. is selected] What is the name of your apartment complex?
- [Text entry]
- How much do you pay in monthly rent as an individual?
- [Numeric entry]
- What is your bedroom configuration?
- Single
- Double
- Triple
- Studio
- Other: [Text entry]
- How many bedrooms are in your house/apartment?
- 1
- 2
- 3
- 4
- 5+
- How many bathrooms are in your house/apartment?
- 1
- 2
- 3
- 4+
- Including yourself, how many housemates do you live with?
- 0
- 1
- 2
- 3
- 4
- 5
- 6+
- Do you have an individual or shared lease?
- Individual
- Shared
- Rank the following methods of transportation to campus from most used to least used:
- Bike
- Bus
- Drive
- Walk
- [If 8b. is selected] Which line(s) do you use most frequently?
- A checklist of all Unitrans supported bus lines as well as Yolobus lines 42A, 42B.
- On average, how long does it take for you to get to campus?
- 0 - 10 minutes
- 10 - 20 minutes
- 20 - 30 minutes
- 30 - 40 minutes
- 40 - 60 minutes
- 1hr +
- Do you own a car in Davis?
- Yes
- No
- Rate the following regarding quality of life at your housing.
- Accessibility to nearest grocery store
- Accessibility to nearest bus stop
- Accessibility to entertainment
- Maintenance/Management
- Housemate/Roommate Relationships
- Quietness
- Safety
- Privacy
- How many nights a week do you expect to spend in your home in Davis
- 1-2 days a week
- 3-4 days a week
- 5-6 days a week
- 7 days a week
- Have you experienced issues with management or maintenance
- Yes
- No
- Which of the following issues have you experienced
- Mold
- Broken Appliance
- Lighting/Electricity
- Plumbing
- AC/Heat
- Trash/Waste Disposal
- Issue with deposit returns
- Lack of Communication
- Other: [Text entry]
- Are you able to use financial aid/scholarship funds to pay for housing?
- Yes
- No
- N/A
- Have you experienced housing insecurity in the past year?
- Yes
- No
- All things considered, do you feel your housing is worth the cost?
- Yes
- No
- How aware are you of the following resources?
- ASUCD HAUS (Housing Advising for Undergraduate Students)
- HTAC (Housing and Transportation Advocacy Committee)
- CHL (Community Housing Listing)
- Housing Day
- Aggie House
- Aggie-Aid Grant
- Aggie Compass
- UC Davis should provide more housing information to students.
- Strongly agree
- Agree
- Neutral
- Disagree
- Strongly disagree
- Would you be interested in expanded cooperative housing? (Ex: the Domes or Tri Co-ops)
- Yes
- No
- Feel free to leave questions, concerns, or comments here.
- [Text input]
Appendix B: Survey Figures
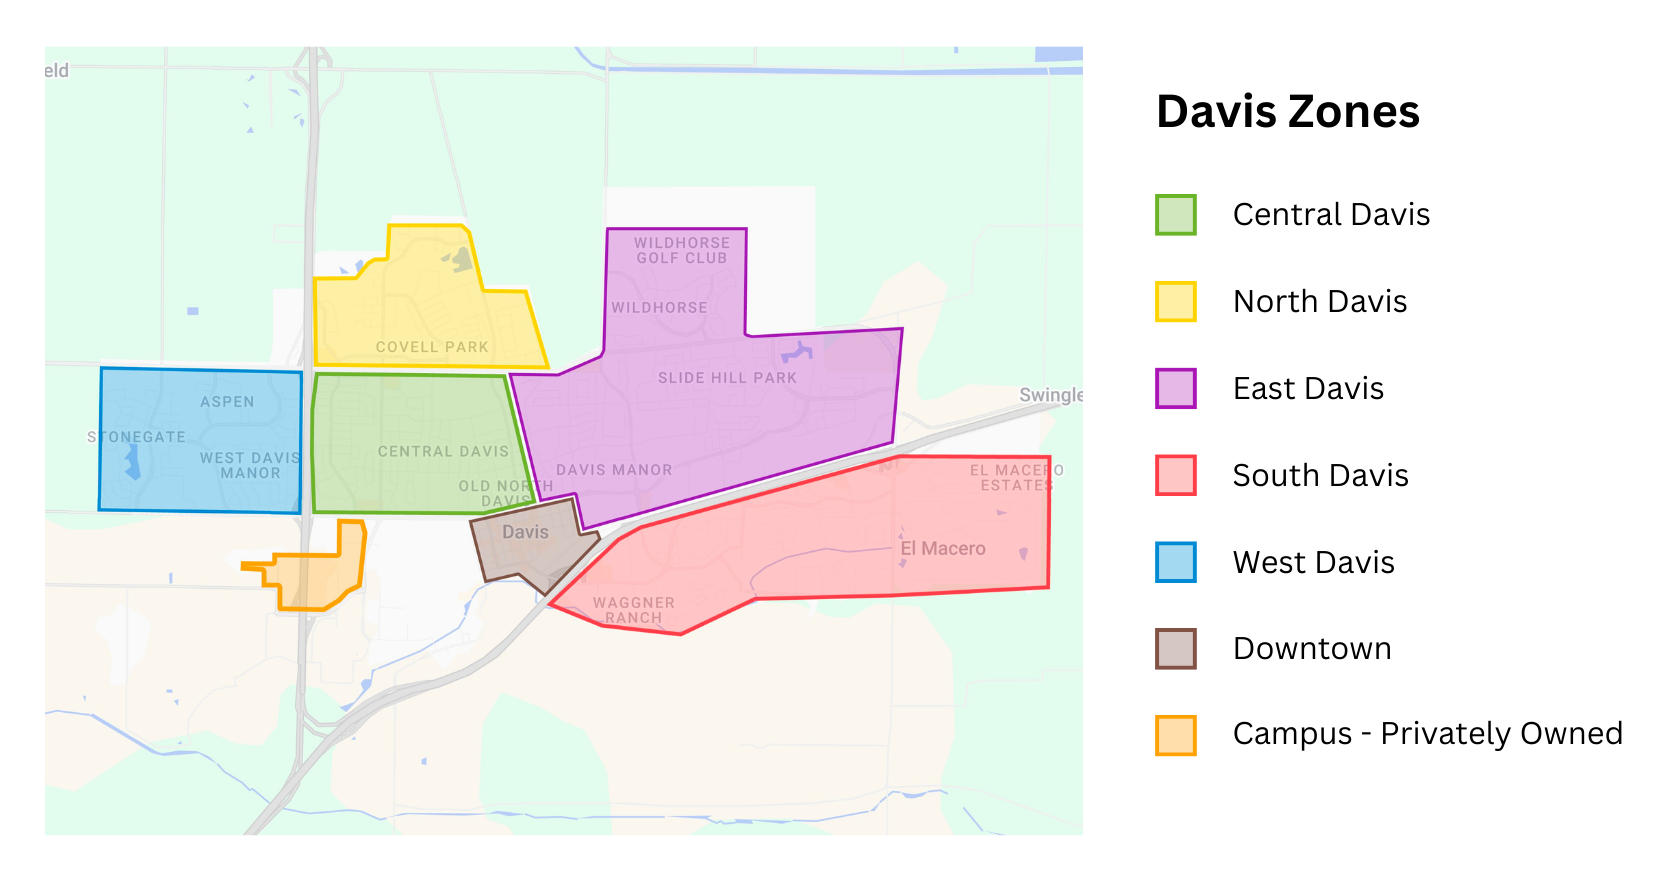
Figure 1: A map of Davis housing zones provided in Survey Question #3.
References
Christopher, Ben, and Manuela Tobias. “Californians: Here’s Why Your Housing Costs Are so High.” CalMatters, 15 Oct. 2024, calmatters.org/explainers/california-housing-costs-explainer/.
Easley, Julia Ann. “Record Number Apply for Undergraduate Studies at UC Davis.” UC Davis, 18 Feb. 2025, www.ucdavis.edu/news/record-number-apply-undergraduate-studies-uc-davis-0.
Risser, Michelle K. “Living in Davis.” Continuing and Professional Education | International, 6 Dec. 2020, cie.ucdavis.edu/student-life/living-davis#:~:text=With%20a%20population%20of%20around,town%20with%20rich%2C%20cultural%20activities.
Shah, Simmone. “Median Rental Prices by State in the U.S.” Time, Time, 25 Jan. 2024, time.com/6588782/median-rent-prices-us-america-housing/.
Sysavath, Robyn M. “Aggiemetrics Description.” AggieData, 8 Feb. 2021, aggiedata.ucdavis.edu/aggiemetrics-description.
Tobias, Manuela. “How California’s Housing Crisis Hurts College Students.” CalMatters, 17 Nov. 2022, calmatters.org/housing/2022/11/california-student-housing-crisis/.