


2025 Undergraduate Basic Needs Report
Introduction & Objectives
Basic needs analysis is a core component of university research and planning, with educational institutions regularly supporting resources and services that help students navigate college life. Institutions like UC Davis offer a wide variety of resources to its student body, with the goal of providing support and assistance to ensure a successful personal and academic experience. Basic needs vary widely, and are constantly being reconsidered and redefined. Several paradigms exist to define human basic needs. One popular model is Maslow’s Hierarchy of Needs, which describes a hierarchical needs ‘pyramid’ with physiological needs (like food, water, or shelter) at the most basic level, and abstract needs (like self-actualization) at the highest level (McLeod). Some governmental bodies, like the United Nations, define basic needs as essentials for both survival and well-being, including markers of development like health, education, employment, public transportation, and democratic participation (UN).
From a university perspective, several basic needs are of particular importance. Physiological needs, as discussed previously, are always vital, especially elements like food and housing, which are frequent dimensions where student populations face insecurity (CSAC). Other elements, like healthcare or employment, are essential for student success and physical/financial well-being. Despite the aforementioned resources that exist at institutions like UC Davis, there are still gaps in student support, especially for specific high-risk groups. These gaps, areas where students face particular insecurity, are vital to identify and understand, so appropriate actions can be taken to ensure student safety and wellbeing. Students are far more likely to be successful personally and academically if they are supported and secure physiologically, physically, mentally, and financially, making the assessment of basic needs vital for the success of academic institutions.
Project Objectives
The primary objective of this project is to assess the state of the UC Davis undergraduate student body according to several basic needs dimensions, including healthcare, housing, food, hygiene, and employment. This work aims to identify gaps in undergraduate well-being, and understand how ASUCD basic needs resources are addressing these gaps. The primary ASUCD/UC Davis resources considered were Calfresh/SNAP, the ASUCD Pantry, Aggie Compass, Aggie Aid, Aggie Reuse, ASUCD Student Health and Wellness (SHAW), and ASUCD HAUS/VESTA.
As part of this assessment, ASUCD IRL will give feedback and recommendations to the ASUCD Executive Office, Senate, and units/commissions based on survey response analysis. IRL hopes to analyze what demographic groups struggle in different basic-needs categories, and how elements of different basic-needs interact with each other.
Methodology
Data Collection
A Qualtrics survey was used to collect 351 responses between October 6th, 2025, and October 13th, 2025. Participants were recruited through two tabling sessions which took place on October 6th and October 9th. To encourage responses and thank participants for their time, each response was compensated with one cookie. 150 cookies were handed out at each tabling session. As an additional method for data collection, the ASUCD Executive Office sent an email message advertising the survey to the student body.
Data Processing
To ensure data accuracy, integrity, and quality, the distribution of response times were modeled. The resulting distribution was approximately normal, so all responses less than two standard deviations below the mean response time were excluded from analysis. The mean response time was 150.01 seconds, and the standard deviation was 63.79 seconds. Two standard deviations below the mean corresponds with approximately 2.5% of respondents, following the empirical rule. Responses that fell below the cutoff were removed to account for students selecting answers without fully reading questions, which could skew results. After processing, a total of N = 337 responses remained, reduced from the original 353. Partial responses were kept, with incomplete responses being dropped for analysis involving missing data.
Methods of Analysis
This report employs a variety of visualization and statistical techniques. Simple visualizations like bar graphs and tables were used to highlight the distributions of responses to single questions (univariate analysis), and while exploring relationships between responses to multiple questions (bivariate/multivariate analysis).
Most statistical methods used are non-parametric, meaning they carry fewer expectations about the distribution of responses to each question. These methods do not assume that the data follows a normal distribution / bell curve, so they are better for our relatively small sample size for certain groups and research questions.
These methods are also appropriate for ordinal data. Many of our survey questions prompted respondents to respond by selecting one level of a likert scale; an example of a likert scale is a five-option multiple choice question ranging from “Strongly Disagree” to “Strongly Agree”. Likert scales produce ordinal data; “Strongly Disagree” to “Strongly Agree” follows a clear order, but we cannot assume that the distance between two adjacent points is the same for every respondent. For example, one respondent’s “strongly agree” could be equivalent to another respondent’s “agree”. We have taken this into account while conducting analysis, avoiding methods that would assume equal distance between scale points.
The non-parametric methods used include:
- Kendall’s Tau — used to measure the association between two variables.
- The Kruskall-Wallis test — used to determine whether survey response distributions differ between three or more groups (e.g. first years vs. second years vs. third years). The Kruskall-Wallis test is used as an alternative to ANOVA when parametric assumptions are violated (as is the case with ordinal data).
- Chi-Square Test — used to determine whether one categorical factor (like struggling to access mental healthcare) is related to another categorical factor (like using SHAW).
- Fisher’s exact test — used to determine whether one factor (like struggling to access mental healthcare) is related to another factor (like using SHAW). This method is an alternative to the Chi-Square test when expected counts are small.
- The Mann-Whitney U test — used to determine whether survey response distributions differ between two groups (e.g. first years vs. second years). The Mann-Whitney U test is used as an alternative to the two-sample t-test when parametric assumptions are violated (as is the case with ordinal, Likert-style data).
Other methods include:
- Linear regression — used to model the relationship between variables and estimate how much one variable changes for each unit increase in another. This was used to calculate the average increase in SHAW awareness per increase in the start year.
- Logistic regression — used to predict the likelihood of a binary outcome (like yes/no, satisfied/dissatisfied) based on one or more factors. This was used to determine which types of healthcare struggles were predictive of SHAW use, and to model the relationship between HAUS awareness and HAUS use.
All data was cleaned and analyzed using R. Packages utilized include the tidyverse library (including ggplot and dplyr), gt and gtsummary, psych, rstatix, and coin. For all hypothesis testing, a significance level of ɑ = 0.05 was used. This value corresponds to the probability of committing a Type I error, and is the cutoff used to determine the significance of a p-value.
Data Analysis
Sample Characteristics (Demographics)
All collected demographic information was optional, with respondents having the ability to skip questions should they choose to. Demographics questions were split into academic, financial, and personal identity categories.
Academic Demographics
The academic category consisted of questions on start year, college, transfer status, international status, and first generation status. Among respondents (N=319), The majority of respondents began at UC Davis in 2024 (34%). 43 students (13%) began in 2025, and 74 (23%) and 75 (24%) students began in 2022 and 2023, respectively. A total of 17 students (5.3%) started in 2021 or before.
Collected college demographics aligned well with known population demographics (https://aggiedata.ucdavis.edu/). The survey sample had 79 (25%) students from the College of Agricultural and Environmental Sciences, which is close to the true population percentage of 25%. 65 (20%) of respondents were a part of the College of Biological Sciences, and 60 (19%) were from the College of Engineering. The dominant college was the College of Letters and Sciences with 115 (36%) of responses, which is relatively close to the true population percentage of 40%.
45 (14%) of students were transfer students, and 36 (11%) were international students. Among respondents, 110 (34%) reported being first generation college students.
All academic demographics are summarized in Appendix A. Table 1.
Financial Demographics
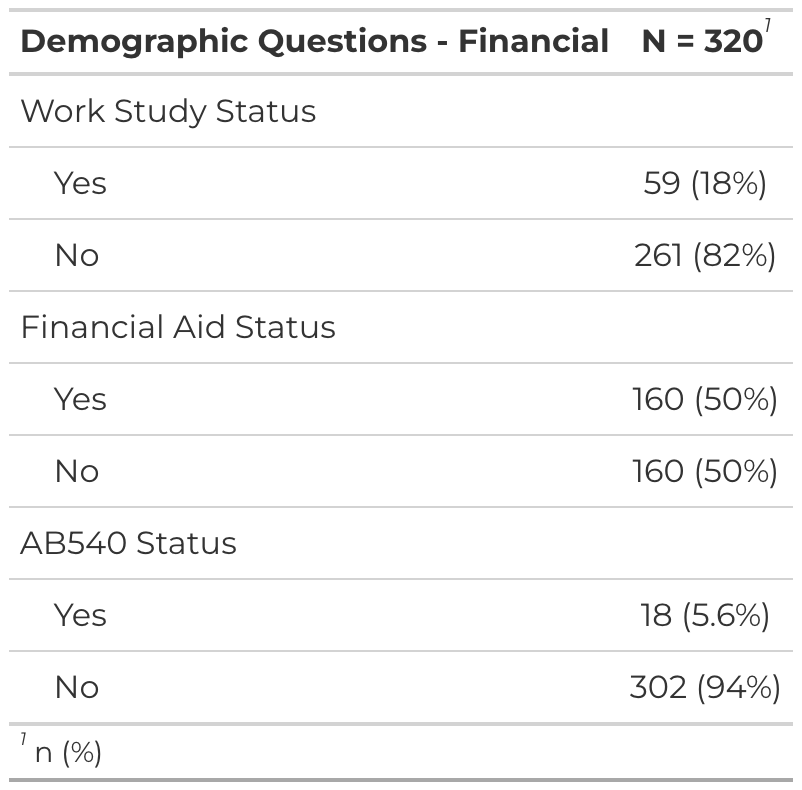
The financial category consisted of questions on work study, financial aid, and AB540 status. 59 respondents (18%) reported participating in a work-study program, and 160 respondents (50%) reported utilizing financial aid. Respondents were additionally asked whether they utilized the California Nonresident Tuition Exemption, commonly known as AB540 exemption. This exemption allows certain students who meet residency requirements, including undocumented students, to be exempt from paying nonresident tuition at California public institutions. 18 respondents (5.6%) reported utilizing the AB540 exemption.
All financial demographic information is displayed in Appendix A. Table 2.
Personal Identity Demographics
The personal identity category consists of questions on gender, ethnicity, and race. 205 respondents (64%) reported their gender as female, with 91 (29%) reporting male. 15 students (4.7%) reported their gender identity as non-binary/other. This reflects UC Davis undergraduate population demographics closely, with 60.9% being female and 39.1% male. 68 respondents (21%) reported their ethnicity as hispanic or latino. Race demographics are similar to previous IRL survey work, with a majority of respondents being Asian (180, or 57%).
The full personal identity demographic information is displayed in Appendix A. Table 3.
Housing
Summary of Responses
Housing was considered a critical dimension of undergraduate basic needs, with four questions being designed to assess students' experiences with housing affordability and stability. Students were asked if they had experienced housing insecurity in the past year through a binary question (yes/no), with 37 respondents (11%) responding ‘Yes’ (Appendix A. Table 4.)

The definition of housing insecurity was not explicitly stated in the survey text. For the purposes of this survey, housing insecurity is defined as the lack of safe, stable, or affordable housing, including conditions such as poor-quality housing, overcrowding, being unable to afford rent, and homelessness.
To study the financial aspect of housing insecurity, respondents were asked how often they have struggled to afford their housing, on a five-point Likert scale. The response options were ‘Never’, ‘Sometimes’, ‘About half the time’, ‘Most of the time’, and ‘Always’. This question quantifies financial housing insecurity on an ordinal scale, where responses indicating higher frequencies are associated with higher levels of housing insecurity, in an abstract sense. Among respondents (N=329), 205 (62%) said they never struggled to afford housing, with an aggregated 38% answering sometimes or more. Full responses are summarized graphically in Figure 2 and numerically in Table 1.


A recurring theme for comparison was how basic need dimensions interacted with each other, and how students balance limited financial resources across several basic need categories. To this end, respondents were asked if they had delayed the purchase of other basic needs (like food or clothing) to cover housing costs, in the form of a yes/no question. 96 respondents (29%) answered yes.


Completing the housing section of the questionnaire, respondents were asked whether they feel confident they will have stable housing for the next 6 months. This question was designed to assess what factors influence future beliefs about an individual's housing situation, and see what differences exist between current housing insecurity and future housing stability. To account for respondent uncertainty, ‘Yes’, ‘No’, and ‘Maybe’ were given as response options. Of the 327 responses collected for this question, 261 of those surveyed (80%) responded yes, 53 (16%) responded maybe, and 13 (4.0%) responded no.


Related to housing, questions were asked about ASUCD/University resources corresponding with various basic needs categories. Regarding housing, respondents were asked about their familiarity, and use of, ASUCD HAUS/VESTA resources. Housing Advising for Undergraduate Students (HAUS) is an ASUCD unit focused on providing support for students searching for housing or experiencing housing insecurity. Vital Emergency Shelter and Transitional Assistance (VESTA), is a subunit of HAUS that supports Aggie House, a transitional housing program for undergraduate students (Basada). Familiarity was assessed on a 5 point Likert scale, with responses including ‘Not familiar at all’, ‘slightly familiar’, ‘moderately familiar’, ‘very familiar’, and ‘extremely familiar’.


A majority of students (61%) reported being not familiar at all with HAUS. In conjunction with this question, respondents were asked whether they used HAUS/VESTA resources, in the form of a yes/no question. From the collected responses, 7.7% of students (25) have used HAUS/VESTA resources.


Exploratory Analysis
To prepare for targeted statistical testing, exploratory analysis was also conducted on the relationship between housing questions and key demographic variables.
Housing insecurity was relatively similar among different racial demographics, with small sample sizes for Native Hawaiian/American Indian groups contributing to higher variance in housing insecurity. For different racial groups, responses to whether one has delayed the purchase of other basic needs is statistically similar, though proportions are higher compared to housing insecurity responses across groups.


Housing insecurity was considered across start years at Davis as well, with no immediately meaningful variation detected. The reported rates of housing insecurity was much higher for those starting their time at UC Davis in 2021 or before, though this demographic group represents a much smaller proportion of respondents (17, or 5.3%). The summary of housing insecurity by start year can be found in Appendix B. Figure 1.
Bivariate analysis was conducted on the relationship between different housing insecurity indicators. Relationships were considered for all housing questions, for a total of 6 relationships examined.

A correlation matrix was constructed, using Kendall’s Tau as the measure of association. Kendall’s Tau is a non-parametric alternative to Pearson’s r correlation coefficient, and is appropriate for the ordinal response data. Individual statistical testing for association was conducted on specific variable pairings based on this exploratory matrix, described below. Further bivariate visualization can be found in Appendix B. Figure 2.
Research Questions and Statistical Analysis
Based on exploratory analysis, the primary research categories and questions considered were:
- Studying housing insecurity based on financial demographics
- Do groups that utilize financial resources experience more housing insecurity?
- Studying experienced housing insecurity, and knowledge/use of ASUCD resources
- Are groups that experience more housing insecurity more familiar with ASUCD housing resources?
- Do groups that experience more housing insecurity use more ASUCD resources?
- Do groups that are aware of ASUCD housing resources use them?
Statistical methods used for analysis include non-parametric testing for difference between groups via the Mann-Whitney U test, Chi-squared/Fisher’s Exact test for associations, Kendall’s Tau test for associations, and logistic regression for prediction of binary outcomes. To quantify statistically significant relationships, rank-biserial correlation, Chi-squared Phi coefficient, odds ratio, and Kendall’s Tau were selected for effect sizes.
Findings
Finding 1: Students that fall into three financial-need demographic categories struggle to afford housing more frequently, but are not more likely to use ASUCD housing resources.

Students that were members of financial-need subdemographics include those on financial aid, those utilizing work-study programs, and those who use the AB540 Tuition Exemption. Family-wise Mann-Whitney U tests were conducted on each group pairing (on financial aid vs not on financial aid, etc), utilizing a Holm-Bonferroni correction method to adjust for multiple comparisons. Based on the results of the tests, all financial-need groups were found to report struggling to afford housing more frequently (Appendix A. Table 5.). Of the three financial-need groups, work-study had the strongest association with more frequent housing affordability struggles, with a rank-biserial correlation of 0.38. Financial aid had a rank-biserial correlation of 0.29, and AB540 had a correlation of 0.15. All financial-need groups had statistically significant increased affordability struggles compared to respondents not in financial-need groups, with corrected p-values of 0.0003, 0.0003, and 0.0042.
After determining financial-need groups have more frequent housing affordability struggles, the relationship between financial demographic and ASUCD resource-use indicators was determined. A series of Chi-Square/Fisher’s Exact tests for association with Holm correction were conducted to determine whether there was a positive relationship between being a part of a financial-need group, and utilizing HAUS/ASUCD resources. With the previously stated significance level of 0.05, no financial demographic had a statistically significant relationship with using ASUCD resources. Financial-aid, work-study, and AB540 as indicators for using HAUS all had corrected p-values of 0.084 (Appendix A. Tables 6, 7, 8.). This finding shows at-risk groups that should be targeted for future outreach, and shows a disconnect between those who would benefit from ASUCD housing resources and those that actually use them.
Finding 2: Students that struggle to afford their housing more frequently have slightly greater familiarity with HAUS.

Determining if those that experience housing insecurity are familiar with ASUCD housing resources was seen as a vital way to determine whether vulnerable students were connecting with resources available to them. Two primary variables were compared against respondent’s ranking of HAUS familiarity: experienced housing insecurity and frequency of housing affordability struggles. Both variables present different views on housing insecurity, with frequency of housing affordability struggles being answered on a Likert-style 5 point scale, and experienced housing insecurity being a yes/no binary response. The frequency of affordability struggle question was the chosen indicator for familiarity analysis, since its ordinal scale would give more sensitivity to incremental differences compared to a binary response.
To this end, a Kendall’s Tau test rank correlation test was used to compare the statistical significance and strength of the relationship between housing insecurity and HAUS familiarity. Kendall’s Tau is a non-parametric ranked alternative to Pearson’s correlation test, and is preferred over other non-parametric association measures (like Spearman’s Rho) when there are many ties in the dataset. The calculated p-value was 0.0466, and the corresponding effect size Tau was 0.1 (Appendix A. Table 9.). This indicates a statistically significant, but weak, positive relationship. This result shows that students who experience greater housing insecurity are slightly more familiar with ASUCD housing resources. This finding represents a success in outreach to at-risk students, and shows that ASUCD should continue to market relevant resources to at-risk students.

Finding 3: For every one point increase in familiarity with HAUS, the odds of students using HAUS increase by 2.1 times.

To determine the usefulness of ASUCD housing resources to the student body, the relationship between familiarity with HAUS and actual use of HAUS was determined. Though it is obvious that those who use HAUS will be familiar with it, it is not immediately apparent if being familiar with HAUS is a relevant predictor of the use of it. To investigate this relationship, a logistic regression model was constructed, where the binary response variable ‘Uses HAUS’ was regressed on the ordinal predictor ‘Familiarity with HAUS’. The model constructed was statistically significant, with a calculated odds ratio of 2.09.

Based on the model output, familiarity with HAUS is a relevant predictor of use of HAUS, indicating that increased awareness can be a successful strategy to increase use of ASUCD housing resources. An odds ratio of 2.09 means that, for each one-unit increase in familiarity (on a 1-5 scale), an individual respondent's odds of using HAUS resources increases on average by 2.09 times.

Hygiene
Summary of Responses
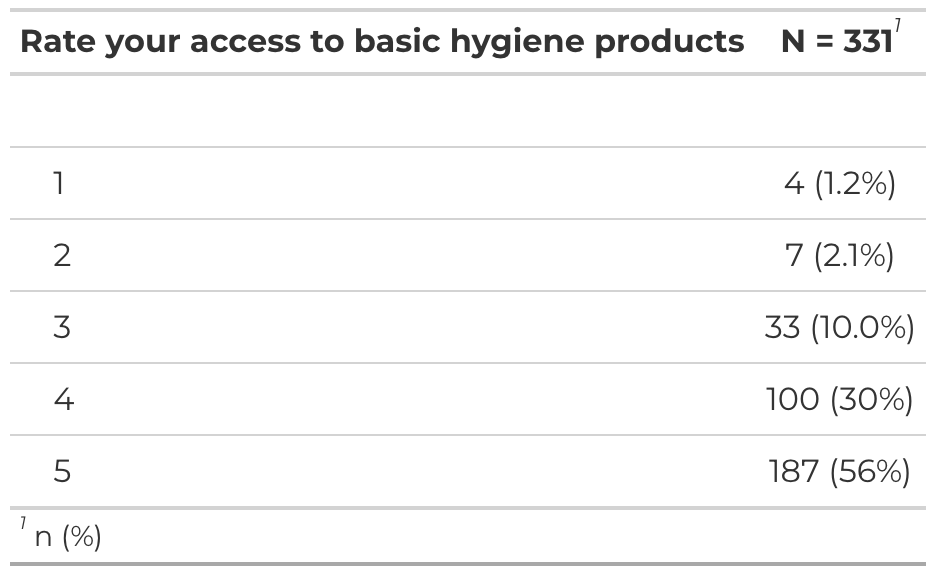
The ASUCD Basic Needs survey included a short section on personal hygiene, which assesses student access to personal care products, as well as feminine hygiene products for those who use them. Respondents were asked to rate their access to basic hygiene products (such as soap or oral care) on a 1-5 Likert scale, with 1 being worst and 5 being best. 187 students (56%) rated their access as a 5, and an additional 100 students (30%) selected 4. 33 students, or 10%, selected 3, and a combined 2.3% selected 1 or 2 (Appendix A. Table 10.).
Feminine hygiene was considered a separate category from other basic hygiene products, which includes products related to period care, such as tampons. 68% of respondents reported using feminine hygiene products. The remaining questions in the personal hygiene category were only shown to those who use feminine hygiene products.
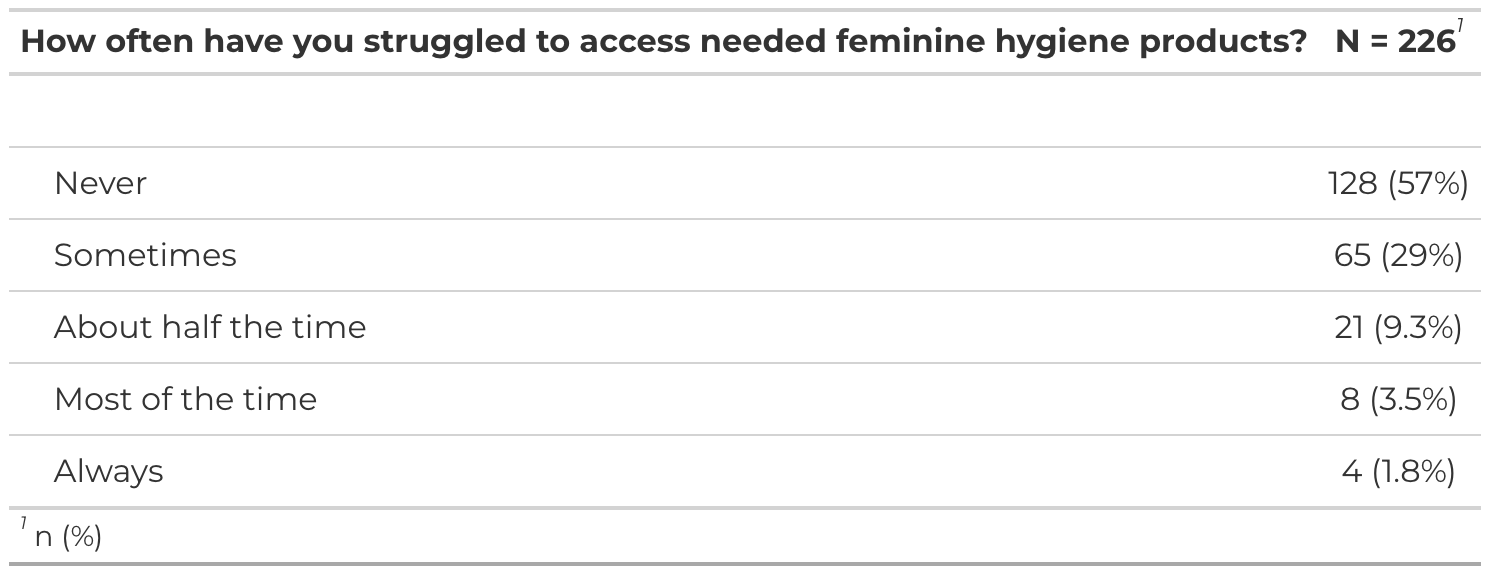
Students were asked how often they struggled to access feminine hygiene products, on a Likert-style scare with the options ‘Never’, ‘Sometimes’, ‘About half the time’, ‘Most of the time’, and ‘Always’. 57% of respondents selected ‘Never’, and 29% selected ‘Sometimes’. See Appendix A. Table 11. for full breakdown of responses.

Figure 16.
On-campus access to feminine hygiene products was also evaluated, with 42% of respondents selecting ‘Yes’ to the question, “Have you had difficulty obtaining feminine hygiene products on campus?”

Finally, respondents were asked how often they had been unable to afford period products on a similar Likert scale. 66% of respondents selected ‘Never’, with an additional 23% selecting ‘Sometimes’. 11.5% of respondents select ‘About half the time’ or more.
Exploratory Analysis
Exploratory analysis of the hygiene dimension focused on access indicators across various demographics, as opposed to exploration of bivariate relationships between variables. All variables exhibited strong multicollinearity, with respondents having similar responses when comparing paired data. Difficulty obtaining feminine hygiene products on-campus was analyzed per academic college. Students in the college of engineering reported the highest rate of difficulty obtaining period products on campus, followed by Letters and Science, Biological Sciences, and Agricultural and Environmental Sciences.

No significant differences were found between ‘Difficulty obtaining on-campus’ indicator and college (Appendix A. Table 15.).
Research Questions and Statistical Analysis
Based on exploratory analysis, the primary research question was:
- Does struggling to access on-campus feminine hygiene products vary by college significantly?
Findings
No significant findings were found relating to hygiene research questions.
Healthcare
Summary of Responses
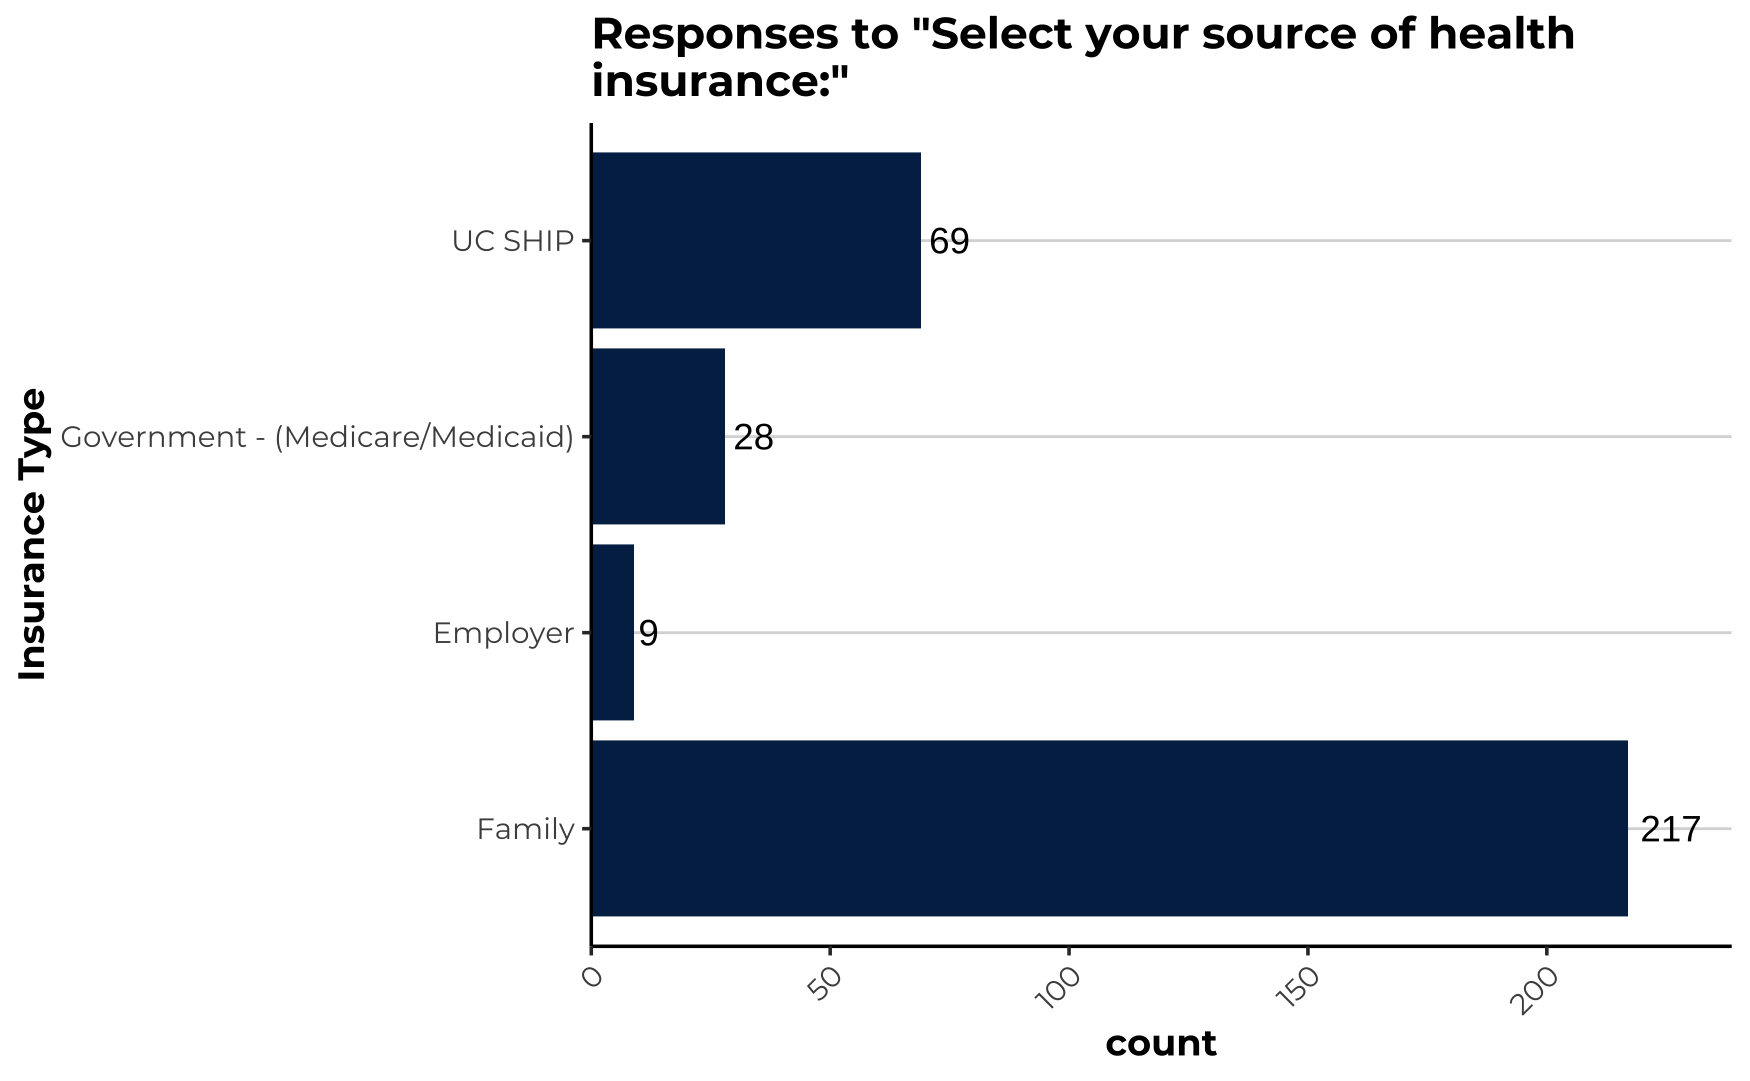
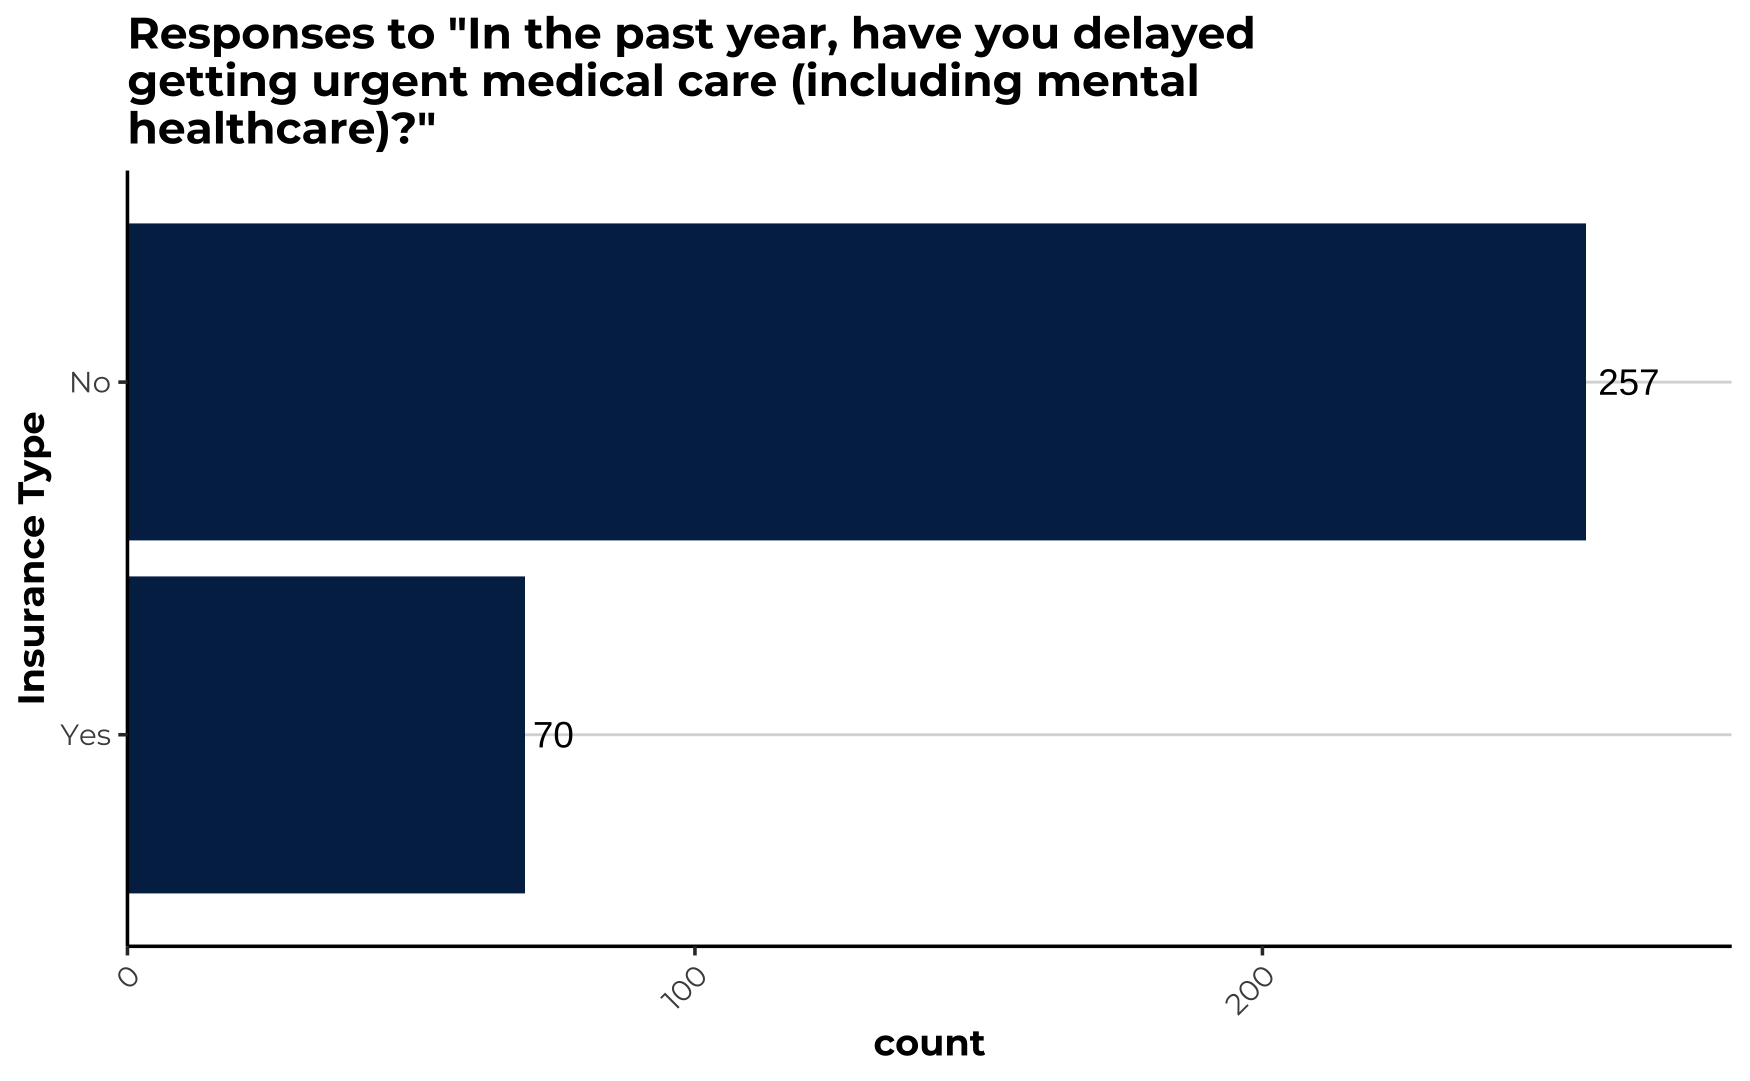
217 respondents are on their family's insurance plan, while 69 use UC SHIP, 28 use government-issued insurance and nine are insured through their employer (Appendix B. Fig. 3). When asked how frequently they struggle to afford their insurance coverage, most respondents answered either N/A (114) or Never (170) — which is expected from a sample mostly made up of family-insurance users (Appendix B. Fig. 4). Asking "In the past year, how often have you been unable to afford your healthcare needs?" revealed more problems; 30.3% of respondents answered at least "Sometimes" (Appendix B. Fig. 5). Further questioning about the affordability of mental health care showed that, within the past year, 40.0% of students struggled to afford or access mental healthcare at least sometimes (Appendix B. Fig. 6). Furthermore, 21.4% (n=70) of respondents stated that, within the last year, they delayed getting urgent medical care (including mental healthcare) (Appendix B. Fig. 7). For these 70 respondents who delayed their care, the most common reasons for doing so included lack of transportation (n=32) and being unable to miss class (n=39) (Appendix B. Fig. 8).

Findings
Finding #1: Younger students struggle with transportation to receive healthcare.
15/32 respondents who lacked transportation to receive urgent medical care were second-years (start year 2024). This makes sense — first years (start year 2025) are less likely to have experienced urgent medical need because they've only been in Davis for a few months. Since second-years were over-represented in our sample (110/322 respondents started classes in 2024), Fisher's Exact test was ran, concluding that a second-year's probability of delaying care due to transportation issues isn't statistically different from any other year's probability of delaying care due to transport issues (p = 0.077).
Finding #2: First-gen students experience healthcare struggles at much higher rates, but don’t use SHAW at higher rates, and aren’t more aware of SHAW.


The Kruskall-Wallis shows that first-gen students in our sample struggle more with access to mental health care and healthcare affordability. Additionally, a higher proportion of first-gen students have delayed their healthcare within the past year, and a higher proportion have struggled with paying for insurance.
Finding #3: SHAW usage doesn’t differ significantly by race, gender, ethnicity, and start year.

Finding #4: SHAW awareness increases at roughly the same rate by year for transfer and non-transfer students.


Finding #6: Students who struggle to access healthcare are more likely to use SHAW — struggling to access mental health care is a particularly strong predictor of SHAW usage.

We used logistic regression — a statistical method to determine which factors are most predictive of a binary outcome — to analyze variables that are predictive of SHAW use. As shown in the table above, struggling to access mental healthcare “Sometimes”, “About half the time” and “Most of the time” are all significant predictors of SHAW use. The “OR” column can be interpreted as: “a student who struggles to access mental healthcare sometimes is 2.94 times more likely to use SHAW”.
Food
Summary of Responses
Food needs were identified as an important dimension of basic needs, with the survey asking four questions assessing students’ experiences with food insecurity. Students were asked how often they worried about running out of food before having money to buy more using a five-point Likert scale to assess anxiety related to food, which is associated with food insecurity. . The response options were, “Never”, “Sometimes”, “About half the time”, “Most of the time”, and “Always”, with 43% of respondents reporting “Never” and 35% of respondents reporting “Sometimes”.


Students were then asked how often they ran out of food before having money to buy more using a five-point Likert scale, which quantifies the frequency of lacking resources to be able to eat and therefore pursue other endeavors. The response options were, “Never”, “Sometimes”, “About half the time”, “Most of the time”, and “Always”, with 63% of respondents reporting “Never” and 21% of respondents reporting “Sometimes”.


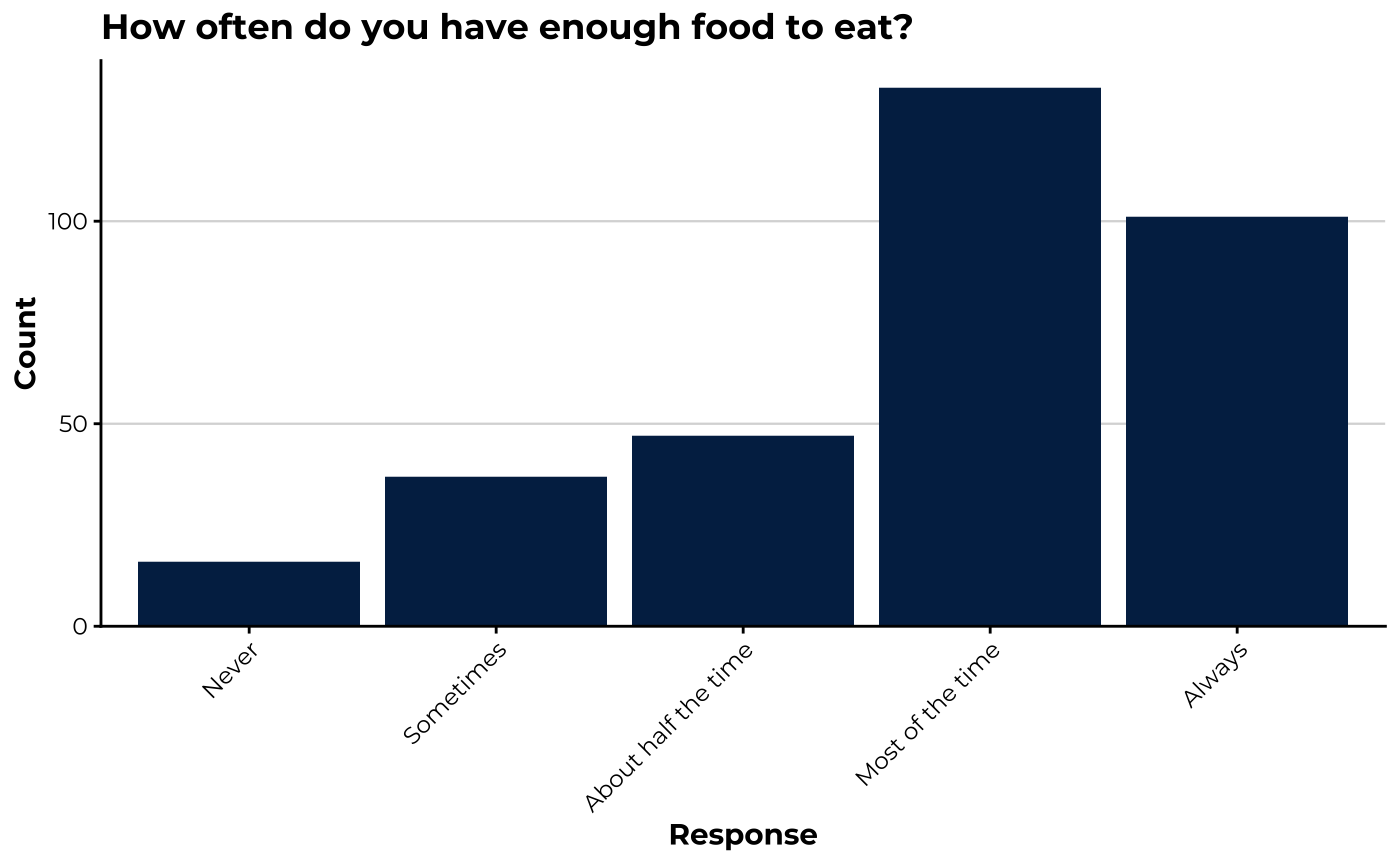
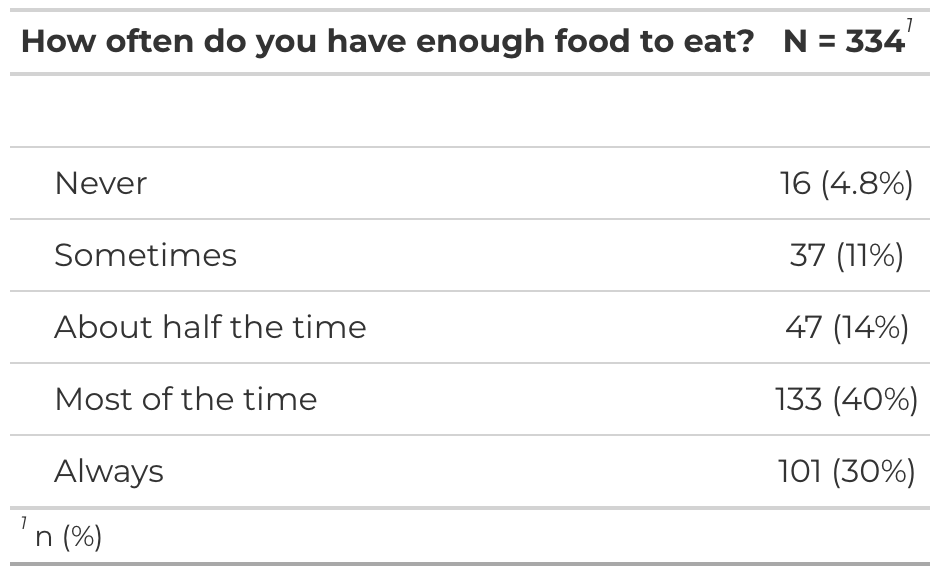
Lastly, students were asked how often they had enough food to eat using a five-point Likert scale to assess students’ consistent access to food. The response options were, “Never”, “Sometimes”, “About half the time”, “Most of the time”, and “Always”, with 30% of respondents reporting “Always” and 40% of respondents reporting “Most of the time”.
Students were then asked about their familiarity with food insecurity resources on campus, firstly, with the ASUCD Pantry. The ASUCD Pantry is a student-run, student-led organization that provides food and other basic essentials to UC Davis students and staff who would like support in acquiring food and other basic necessities. The survey assessed familiarity with a five-point Likert scale, with response options being, “Not familiar at all”, “Slightly familiar”, “Moderately familiar”, “Very familiar”, and “Extremely familiar”, with familiarity being roughly normally distributed.


Then, respondents were asked if they have used the ASUCD Pantry, with 52% of respondents reporting having used the ASUCD Pantry.

Similarly, students were asked about their familiarity with Aggie Compass and Aggie Aid. Aggie Compass and Aggie Aid provides access to nutritious food, assistance applying for CalFresh and other social services, access to economic crisis resources, case management, and immediate shelter and support for unhoused students. The survey assessed familiarity with a five-point Likert scale, with response options being, “Not familiar at all”, “Slightly familiar”, “Moderately familiar”, “Very familiar”, and “Extremely familiar”, with familiarity being left-skewed.


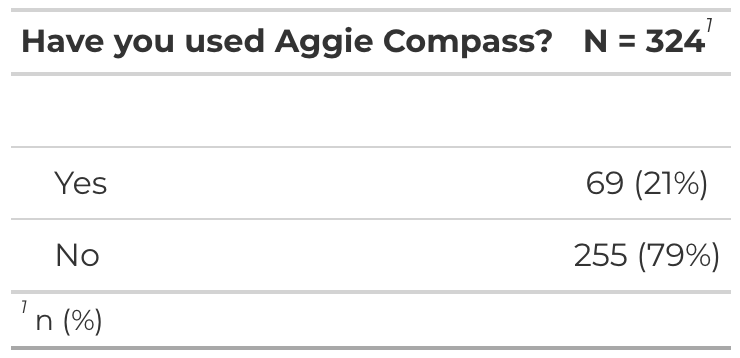
Then, respondents were asked if they have used Aggie Compass, with only 21% of respondents reporting having used Aggie Compass.

Exploratory Analysis
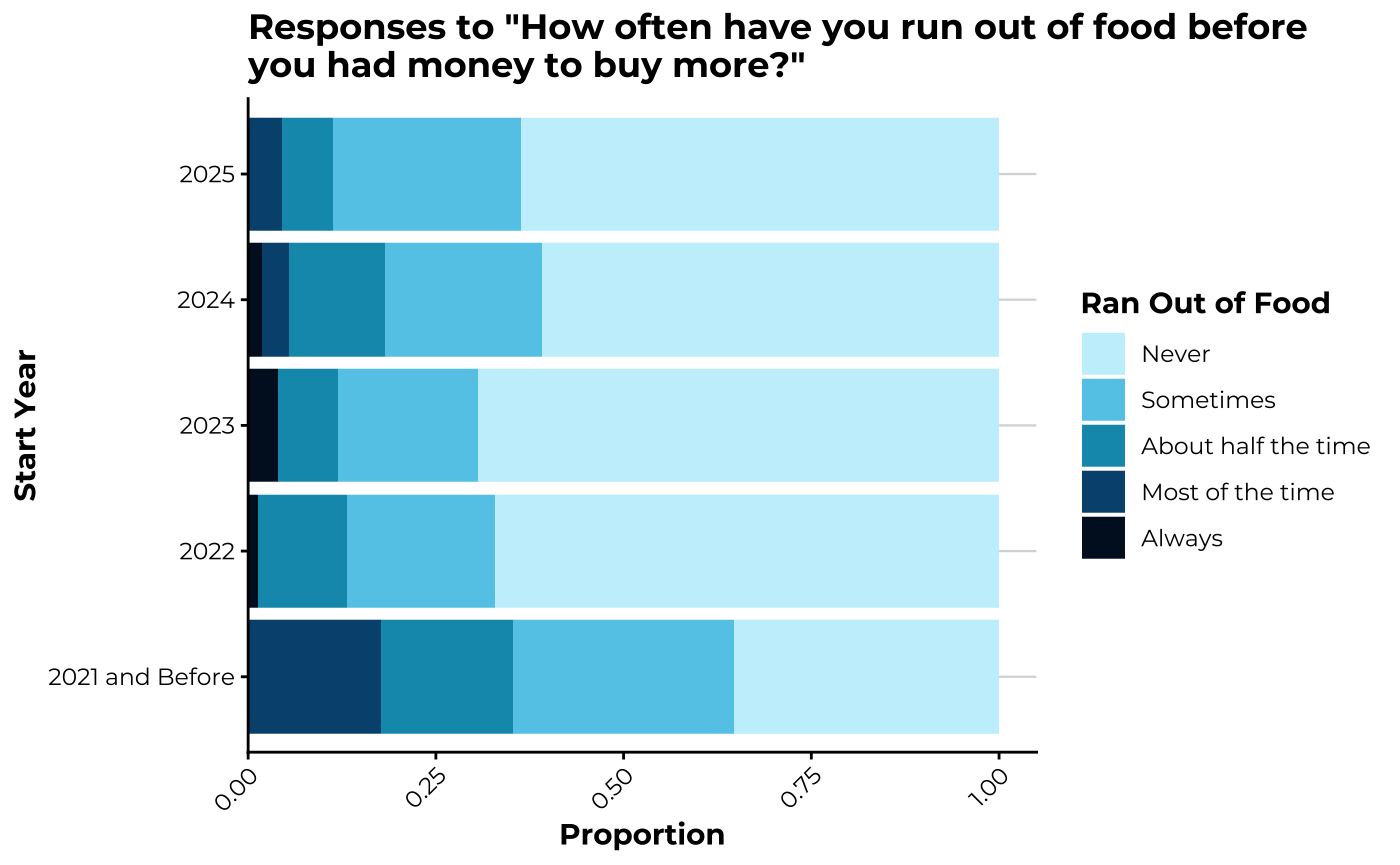
Frequency of running out of food was relatively even amongst start years, with respondents who answered “2021 and Before” having different proportions due to a small sample size.
Frequency of running out of food was relatively even amongst respondents who reported being “White” and “Asian”, with other racial categories having higher proportions due to smaller sample sizes.

Research Questions and Statistical Analysis
The primary research questions proposed after exploratory data analysis for the food insecurity section were:
- Do units with more physical presence have more usage?
- Are students experiencing food insecurity utilizing the appropriate resources?
- Which demographics are most vulnerable to food insecurity?
The statistical methods used for analysis were Fisher’s Exact Test for associations and the Mann Whitney-U Test.
Findings
Finding 1: Students who use the ASUCD Pantry and Aggie Compass are more likely to experience food insecurity than those who do not use these resources.

When performing a Fisher’s Exact Test to see if food insecurity and the Pantry and Aggie Compass usage were correlated, food insecurity was determined by setting the “Never” response on the Likert five-point scale as not experiencing food insecurity, and the other responses being experiencing food insecurity. The usage of the Pantry and Aggie Compass were then regressed on this new food insecurity variable, showing a statistically significant relationship. Therefore determining that those who do experience food insecurity, are more likely to utilize food insecurity resources than those who do not.
Finding 2: Students who indicate receiving any form of financial aid experience food insecurity more frequently than those who do not.


Those who indicate receiving financial aid, having work-study status, or having AB540 status consistently have a lower proportion of students who report “Never” running out of food compared to their counterparts. This discrepancy is most prominent amongst work-study students, where only roughly 25% of respondents reported “Never” running out of food. Performing a Mann-Whitney U Test revealed that there is a significant difference in response distributions to food insecurity questions between Work Study students and students who do not have Work Study Status, with a p-value of < 2e-04.
Finding 3: Familiarity with food insecurity resources varies across financial aid groups.


When examining familiarity with the Pantry among work-study students and students on financial aid and familiarity with Aggie Compass among students on financial and students with AB540 status, the distributions look similar to that of the whole survey sample. However, familiarity with Aggie Compass seems not as left-skewed with work-study students and there seems to be a lack of familiarity with the Pantry amongst AB540 status students.
Finding 4: The Pantry has a much higher utilization rate compared to Aggie Compass.

Despite the fact that both resources have a physical location on campus, Aggie Compass is incredibly underutilized compared to the Pantry, with the Pantry having roughly 50% usage and Aggie Compass only having roughly 25% usage. This could be due to the fact that Aggie Compass’ breadth is much larger than the Pantry’s. Aggie Compass offers a variety of resources all throughout campus apart from their Basic Needs Center, while the Pantry operates from their one location only.
Employment
Summary of Responses
In order to examine the impacts of employment on students’ basic needs, students were surveyed on their employment status, experience job searching, experience with job loss, and whether their jobs paid enough to cover their basic needs.
First, students were asked whether they had a job in the past year through a binary question (yes/no), with 208 respondents (64%) responding ‘Yes,’ and 118 respondents (36%) responding ‘No.’


To gain insight into availability of employment amongst students, respondents were also asked whether they have struggled to find a job in the past year. 157 (48%) of respondents said ‘Yes,’ 127 (39%) responded ‘No,’ and 42 (13%) respondents had not looked.


Among students who worked, we asked how many jobs students had held simultaneously. 117 respondents (57% of students who responded ‘Yes’ to ‘Have you had a job?’) had held one job, 70 respondents (34%) had held two, and 19 respondents (9.2%) had held three or more.


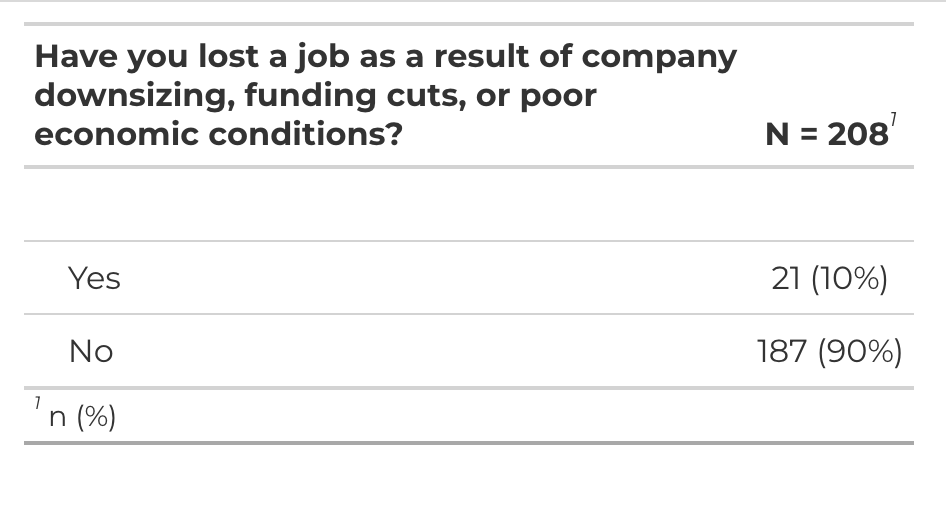
Students who responded ‘Yes’ to ‘Have you had a job?’ were also asked whether or not they had lost a job in the past year as a result of company downsizing, funding cuts, or poor economic conditions. 21 respondents (10%) responded ‘Yes,’ while 187 respondents (90%) responded ‘No.’

Students who responded ‘Yes’ to ‘Have you had a job?’ were also asked whether they worried they would lose a job in the past year as a result of company downsizing, funding cuts, or poor economic conditions. 63 respondents (30%) responded ‘Yes’, and 145 respondents (70%) responded ‘No.’


Lastly, students who responded ‘Yes’ to ‘Have you had a job?’ were asked if their job paid enough to cover essential expenses. The survey text did not explicitly define ‘essential expenses,’ but for the purposes of this survey we will define ‘essential expenses’ as the basic needs discussed such as food, housing, healthcare, hygiene, and clothing. 96 respondents (46%) responded ‘Yes,’ while 112 respondents (54%) responded ‘No.’


Exploratory Analysis
Exploratory analysis focused on identifying possible relationships between employment and key demographics, especially financial indicators, as well as connections between employment and other forms of basic-needs insecurity
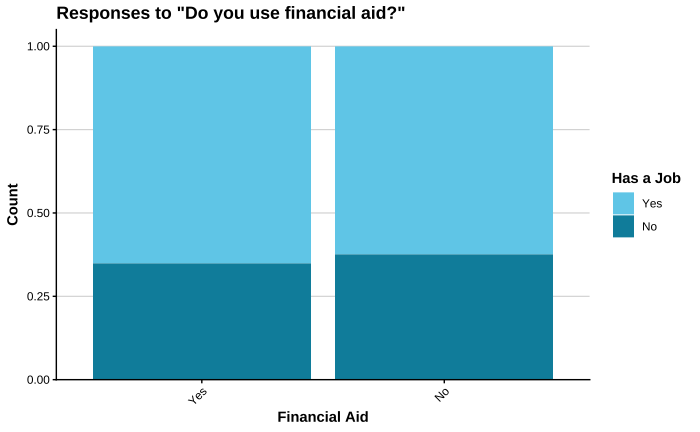
The relationship between the clearest financial indicator, use of financial aid, and employment was examined first. Similar proportions of employment appeared among students who receive financial aid and those who do not.
Participation in a work-study program, another form of financial aid, was also assessed to determine whether it affected students’ ability to find a job. The proportion of students who reported struggling to find a job was similar across work-study participants and non-participants, although a higher proportion of students who were not in a work-study program reported not looking for a job.

One notable finding was the high proportion of students reporting that their job does not pay enough to cover essential expenses (54%). To understand how use of ASUCD or government-funded resources varies among students whose jobs are insufficient to meet basic needs, use of CalFresh and the ASUCD Pantry was graphed among respondents who indicated their job did not provide enough income. The ASUCD Pantry appeared to have more users than CalFresh.

Another relevant ASUCD resource is Aggie Aid, and the analysis considered whether students who had lost jobs were aware of and using this support. When use of Aggie Aid was plotted by respondents who had lost a job versus those who had not, a higher proportion of respondents who had lost a job reported using Aggie Aid.

Statistical Methods and Analysis
The main analysis questions this report will focus on are:
- Do people who have jobs struggle more with basic needs insecurity?
- Are certain financial indicator groups more likely to be employed than others?
- Are students who have lost a job or are worried they will lose a job more likely to use or be familiar with ASUCD resources?
Findings
Finding 1: Students who are employed do not struggle more with basic needs insecurity.
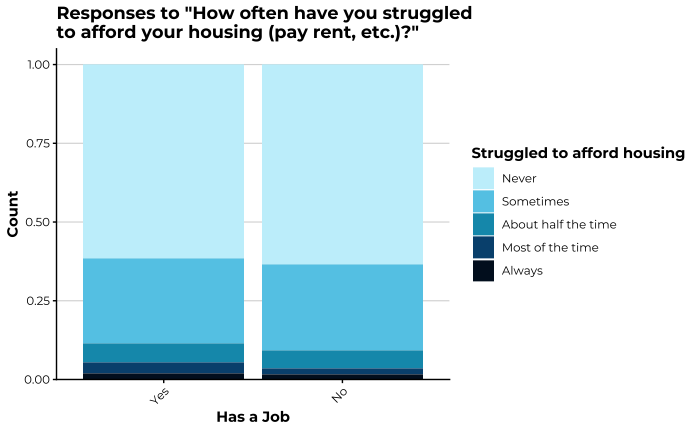
For the three basic needs categories examined in this survey (food, housing, healthcare), questions that asked students to rank their experience on a five-point Likert scale (Never, Sometimes, About half the time, Most of the time, Always) were selected and graphed by responses to ‘Have you had a job.’ Questions using an ordinal scale were selected to account for the varying levels of insecurity that would not be captured by a binary response. A Mann-Whitney U test was performed to determine whether there is a significant difference in response distributions to basic needs insecurity questions between the respondents’ employment status. Interestingly, there was no statistically significant difference between groups for any of the basic needs categories. P-values were 0.2789, 0.6357, and 0.3301 for food, housing, and healthcare respectively.


Finding 2: Financial aid subdemographics (International, AB 540, Financial Aid, No Aid) impacts respondents’ likelihood of being employed .

To compare the proportion of employed students for each financial aid subdemographic, responses to ‘Have you had a job’ were graphed by those who reported to have AB540 status, receive financial aid, or are international students. To account for those who responded ‘Yes’ to multiple categories, hierarchical categories were created to assign each respondent to their highest priority category. AB540 was first priority, since it is a status for specific circumstances and thus those respondents’ defining characteristic. Next priority was international students, since international students generally are not eligible for US financial aid. Next was everyone else who reported to receive financial aid, and respondents who did not respond ‘Yes’ to any of these categories were grouped into the reference group.
A Fisher’s Exact test was performed to calculate the p-value and odds ratio for each of the subdemographics. Based on the odds ratio, financial aid recipients were most likely to be employed, followed by AB540 students, then international students, when compared with those who responded ‘No’ to those questions.

Finding 3: Students who have lost a job in the past year are more likely to have used Aggie Aid, but not necessarily more likely to be familiar with the resource.
Aggie Aid is an emergency relief grant program provided by Aggie Compass to support students experiencing unexpected financial hardships, such as job loss. Respondents were asked to rate their familiarity with Aggie Aid / Aggie Compass on a five-point Likert scale rating their familiarity from ‘Not familiar at all’ to ‘Extremely familiar.’ Respondents were also asked to respond ‘Yes’ or ‘No’ to whether they had used Aggie Aid. It should be noted that while familiarity for Aggie Aid and Aggie Compass were combined in the same question, respondents were asked whether they had used either resource separately.
It was found that students who had lost a job were more likely to have used Aggie Aid, with a Fisher’s Exact test yielding a significant p-value of 0.0001118. However, students who had lost a job were not more likely to be familiar with Aggie Aid or Aggie Compass, with a Mann-Whitney U-test yielding a p-value of 0.1348.


As expected, there was a difference in use of Aggie Aid depending on students’ familiarity with Aggie Aid or Aggie Compass. Using a Kruskal-Wallis rank sum test, a significant p-value of 0.002602 was found.

Conclusion & Recommendations
Recommendations
Several targeted recommendations were developed based on the basic needs dimensions discussed. They can be found here, distinguished by category.
Housing
Recommendation 1: Prioritize students in financial-need demographic categories for HAUS outreach.
ASUCD and HAUS could consider prioritizing outreach to students in financial-need demographics, such as those on financial aid or those who use work-study/AB540. These students tend to struggle to afford housing more frequently, but are not more likely to use HAUS or other ASUCD housing resources. These demographics could be more direct to reach, and would benefit from increased awareness of ASUCD housing resources.
Recommendation 2: Conduct educational outreach to communicate the meaning of ‘housing insecurity’, and what qualifies as experienced insecurity.
ASUCD could consider an educational campaign to inform students on the different aspects of housing insecurity, and how a variety of housing situations can be considered housing insecurity. Students who responded saying they experienced housing insecurity were more likely to use ASUCD housing resources, but very few students claimed they have experienced housing insecurity (11%, table BLANK BLANK). Despite this, a much larger percentage of students have said they have struggled to afford housing or delayed the purchase of other basic needs for housing, both indicators of experienced housing insecurity (table blank, table BLANK TABLE).
Healthcare
Recommendation 1: Improve health-related transportation for first years living in dorms
It is worth examining whether Davis first-years (who live in the dorms and likely don't have a car) can get to and from the hospital easily, when needed. Our survey question about delaying healthcare only addressed "the past year", meaning a third-year who struggled with transportation during their first year at Davis wouldn't be included in the transport struggle group. Bus service from the Cuarto dorms to Kaiser Permanente is poor; it takes about 37 minutes, one-way. Biking is likely not feasible for a student seeking urgent medical care.
ASUCD, in partnership with the Davis Police Department, could consider expanding Saferide coverage to offer rides exclusively from the dorms/campus to Kaiser/Sutter hospitals during the day. Alternatively, SHAW could consider a hospital rides program for students (especially first-years) facing transport difficulty. Additionally, ASUCD could propose a private partnership with Lyft/Uber; asking these companies to offer discounted rides to the hospital for college students. There is some precedent for this; colleges (like CU Boulder) partner with Lyft in a program called Ride Smart, offering free or discounted rides around campus.
Recommendation 2: Expand SHAW outreach to first gen students.
First-gen students faced consistent problems with healthcare affordability and access, as shown above. As such, SHAW should consider prioritizing outreach to this demographic through partnerships with First Generation Seminars and attending events like the fall First-Generation College Celebration.
Recommendation 3: Expand SHAW outreach to transfer students.
SHAW awareness increases at the same rate per year for transfer students. This means they are ultimately less aware of SHAW, as they spend less time in Davis. SHAW should expand outreach to this group — perhaps flyering in the Green or participating in transfer seminars/orientations.
Recommendation 4: Emphasize SHAW mental health resources.
As shown above, struggling with access to mental healthcare is a highly significant predictor of using SHAW. Therefore, SHAW should continue offering its existing mental healthcare resources and events — it appears that they are likely to be used. SHAW should also consider emphasizing these resources while conducting outreach.
Employment
Recommendation 1: Conduct outreach on ASUCD resources to groups for whom employment may be less accessible, such as AB540 status or international students
As seen in Finding 1, students who do not have a job are not more or less likely to experience basic needs insecurity. Considering that financial aid recipients have the highest proportion of employment out of the four financial aid categories examined, one might hypothesize that students with greater financial need might seek employment to cover essential expenses. However, it appears that having a job might level any differences in basic needs insecurity that might account for.
The data does not allow any conclusions to be drawn about the relationship between financial need and employment, but it is apparent that there are lower proportions of employment amongst AB540 status students and international students. Restrictions due to visas or immigration status may be a barrier to finding employment for these groups. Therefore, it will be important that these groups are aware of and can access ASUCD resources that provide aid when income through employment is inaccessible.
Recommendation 2: Direct students losing on-campus jobs to Aggie Aid or Aggie Compass
Students who have experienced job loss are more likely to have used Aggie Aid, but they are not more likely to be familiar with the resource. Perhaps a lack of familiarity is leading to a lower utilization than possible. As seen in Finding #3, students who are more familiar with Aggie Aid are more likely to have used the resource. To increase use of Aggie Aid, it will be important to conduct greater outreach to student populations who need them most, such as students who have lost a job. Although ASUCD may not be able to reach every employer of UC Davis students, a possible way to increase awareness is for on-campus employers to direct students to resources like Aggie Compass when they lose a job.
Food
Recommendation 1: Encourage Aggie Compass to expand their resource education so that students are more aware of the services they provide.
When testing food insecurity and food insecurity resource usage, there was a statistically significant relationship between the two. This indicates that students who are experiencing food insecurity are using the appropriate resources at a higher rate than those who are not experiencing food insecurity, but there is a clear difference in the usage between the two, with Aggie Compass being utilized at a much lower rate. Moving forward, Aggie Compass can try to expand resource education, through tabling or social media efforts, to expose more students to their services so those who need them can receive them.
Recommendation 2: Aggie Compass assessing the student body’s knowledge of their resources and seeing which types of resources are in the most demand.
Aggie Compass offers a variety of resources to UC Davis students, including the AggieEats Food Truck, AggieFresh, CalFresh, Fruit & Veggie Up!, the Memorial Union Community Freedge, Satellite Pantries, and the Teaching Kitchen. All of these resources operate outside of their Basic Needs Center, but all fall under the scope of Aggie Compass, despite having their own names and distinct functions, which might cause confusion amongst the student population.
In the future, Aggie Compass might consider assessing which resources students know fall under Aggie Compass, see which ones students are utilizing the most, and which resources students wish they had. This can highlight gaps in awareness and can allow them to act accordingly to further promote resources that students aren’t as aware of and try to create more cohesive branding and messaging across all of their resources, maximizing utilization.
References
Basada, V. (2025, February 26). The California Aggie. The Aggie. https://theaggie.org/2025/02/25/asucd-senate-creates-new-subunit-to-support-partially-integrate-with-aggie-house-at-feb-20-meeting/
Food and housing basic needs survey 2023. csac.ca.gov. (2023, November 16). https://www.csac.ca.gov/sites/default/files/file-attachments/food_and_housing_basic_needs_survey_2023.pdf
McLeod, S. (2025, October 23). Maslow’s hierarchy of needs. Simply Psychology. https://www.simplypsychology.org/maslow.html
UN. un.org. (n.d.). https://www.un.org/en/development/desa/policy/wess/wess_bg_papers/bp_wess2010_emmerij.pdf
Appendix
Appendix A: Additional Tables






Appendix B: Additional Figures





Appendix C: Survey Questions
Food
- In the last year, how often have you worried that you would run out of food before you had money to buy more?
- Never
- Sometimes
- About Half the time
- Most of the time
- Always
- In the last year, how often have you run out of food before you had money to buy more?
- Never
- Sometimes
- About Half the time
- Most of the time
- Always
- How often do you have enough food to eat?
- Never
- Sometimes
- About Half the time
- Most of the time
- Always
Hygiene
- Please rate your access to basic hygiene products.
- 1
- 2
- 3
- 4
- 5
- Do you use feminine hygiene products?
- Yes
- No
- In the last year, how often have you struggled to access the feminine hygiene products you need?
- Never
- Sometimes
- About Half the time
- Most of the time
- Always
- Have you had difficulty obtaining feminine hygiene products on campus?
- Yes
- No
- In the last year, how often have you been unable to afford period products like pads or tampons?
- Never
- Sometimes
- About Half the time
- Most of the time
- Always
Housing
- In the past year, have you experienced housing insecurity?
- Yes
- No
- In the past year, how often have you struggled to afford your housing (pay rent, etc)?
- Never
- Sometimes
- About Half the time
- Most of the time
- Always
- In the past year, have you delayed the purchase of other basic needs (food, healthcare, clothing, etc) to cover housing costs?
- Yes
- No
- Do you feel confident you will have stable housing for the next 6 months?
- Yes
- Maybe
- No
Healthcare
- Select your source of health insurance:
- Family
- Employer
- Government - (Medicare/Medicaid)
- UC SHIP
- Other
- In the past year, how often have you struggled to pay for health insurance?
- N/A
- Never
- Sometimes
- About Half the time
- Most of the time
- Always
- In the past year, how often have you been unable to afford your healthcare needs? (Prescriptions, procedures, medical equipment, appointments, etc)
- Never
- Sometimes
- About half the time
- Most of the time
- Always
- In the past year, how often have you struggled to access mental health care or resources?
- Never
- Sometimes
- About half the time
- Most of the time
- Always
- In the past year, have you delayed getting urgent medical care (including mental healthcare)?
- Yes
- No
- Select the reason(s) why you have delayed getting urgent medical care (including mental healthcare):
- Lack of transportation
- Couldn’t receive time off work
- Couldn’t receive childcare
- Couldn’t miss class
- Couldn’t afford the copay
- Deductible was too high
- Nervous to see healthcare provider
- Family/cultural reasons
- Other
Clothing
- In the past year, how often have you struggled to afford essential clothing?
- Never
- Sometimes
- About half the time
- Most of the time
- Always
Income/Employment
- In the past year, have you had a job?
- Yes
- No
- In the past year, have you struggled to find a job?
- Yes
- No
- I have not looked
- [If yes to have a job] How many jobs have you held simultaneously?
- 1
- 2
- 3+
- [If yes to have a job] In the past year, have you lost a job as a result of company downsizing, funding cuts, or poor economic conditions?
- Yes
- No
- [If yes to have a job] In the past year, have you worried about losing your job as a result of company downsizing, funding cuts, or poor economic conditions?
- Yes
- No
- [If yes to have a job] In the past year, has your job paid you enough to cover your essential expenses?
- Yes
- No
ASUCD Resource Usage
- Have you used Calfresh/SNAP?
- Yes
- No
- Have you used the ASUCD Pantry?
- Yes
- No
- Have you used Aggie Compass?
- Yes
- No
- Have you used Aggie Aid?
- Yes
- No
- Have you used Aggie Reuse?
- Yes
- No
- Have you used ASUCD Student Health and Wellness (SHAW) resources?
- Yes
- No
- Have you used ASUCD HAUS/VESTA resources?
- Yes
- No
- Rate your agreement: I have been worried that benefits I rely on will be revoked due to changes at the federal level.
- Strongly disagree
- Somewhat disagree
- Neither agree nor disagree
- Somewhat agree
- Strongly agree
Resource Familiarity
- How familiar are you with the ASUCD Pantry?
- Not familiar at all
- Slightly familiar
- Moderately familiar
- Very familiar
- Extremely familiar
- How familiar are you with ASUCD Aggie Reuse?
- Not familiar at all
- Slightly familiar
- Moderately familiar
- Very familiar
- Extremely familiar
- How familiar are you with Aggie Compass/Aggie Aid?
- Not familiar at all
- Slightly familiar
- Moderately familiar
- Very familiar
- Extremely familiar
- How familiar are you with ASUCD Student Health and Wellness (SHAW)?
- Not familiar at all
- Slightly familiar
- Moderately familiar
- Very familiar
- Extremely familiar
- How familiar are you with ASUCD HAUS/VESTA?
- Not familiar at all
- Slightly familiar
- Moderately familiar
- Very familiar
- Extremely familiar
Demographics
- What year did you start at Davis?
- Before 2020
- 2020
- 2021
- 2022
- 2023
- 2024
- 2025
- What college do you study in?
- Letters and Science
- Engineering
- Biological Sciences
- Agricultural and Environmental Sciences
- What is your gender identity?
- Male
- Female
- Non-binary / Other
- Prefer not to say
- Are you Hispanic or Latino?
- Yes
- No
- What is your race?
- American Indian or Alaskan Native
- Asian
- Black or African American
- Native Hawaiian or Pacific Islander
- White
- Two or more races
- Other
- Are you a transfer student?
- Yes
- No
- Are you a part of a work/study program?
- Yes
- No
- Do you use financial aid?
- Yes
- No
- Are you an international student?
- Yes
- No
- Are you a first generation college student?
- Yes
- No
- Do you utilize the California Nonresident Tuition Exemption (Also known as AB540)?
- Yes
- No
Appendix D: Survey Tables/Figures
None.