


Undergraduate Awareness and Usage of Mental Health Resources
Introduction & Objectives
The primary objective of this project is to examine how the general undergraduate UC Davis student body is aware of and utilizes campus mental health resources. Additionally, this project examines the relationship between insurance experiences and UC SHIP, as well as insurance issues in relation to mental health awareness and treatment experiences. Furthermore, this analysis focuses on understanding which services are most recognized and utilized by students, and how they learn about said resources.
By analyzing the quantitative survey data, this student aims to identify areas where outreach and program engagement can be improved. The findings will inform future recommendations for increasing awareness of resources, improving utilization of resources, and reducing disparities among different demographics.
Methodology
Survey Development and Distribution
The Mental Health survey was distributed through Qualtrics and consisted of 15 questions. The survey was open for 6 days, from October 14th to October 20th 2025. Responses were collected through tabling at the Memorial Union by offering respondents a cookie from the Coffee House in exchange for proof of a completed response. In total, 300 cookies were bought from the Coffee House to use for tabling and the survey had 327 responses when it closed.
Data Processing and Analysis
All data was cleaned and analyzed through R. The survey responses were cleaned prior to analysis to assess their validity. The median completion time was 67 seconds. Due to the brief length of the survey, the cutoff time limit for responses was 1/4th of the median response time (approximately 16.75 seconds). Responses with completion times below this threshold were filtered out for analysis. Additionally, responses that were not marked as finished were filtered out. After cleaning the data, the dataset for analysis contained 295 responses.
In data analysis, the Mann-Whitney U or Wilcoxon rank-sum test was used for several findings to evaluate whether two data distributions are equal or not. These tests produce a p-value, which is the probability that the data observed would be reproduced by chance rather than being from nonidentical populations. In this analysis, we are functioning at a 5% confidence level, meaning that our threshold the p-value is 0.05. Therefore, if a test produces a p-value lower than 0.05, we reject the null hypothesis that the two groups are from identical populations.
Key Findings
General Demographics
Finding #1: Second and Third Years make up 62% of respondents.
Among the 291 respondents to this question, 21% began at UC Davis in 2022 or earlier, 30% in 2023, 32% in 2024, and 16% in 2025. Overall, second-year undergraduates represent the largest share of respondents, while first-year students comprise the smallest group.


Finding #2: 20% of respondents are transfer students.
Among the 290 respondents to this question, 58 (~20%) are transfer students while 232 (~80%) are not.


Finding #3: Majority of respondents identify as female.
Among the 291 to the gender identity question, 177 (~61%) identified as female, 88 (~30%) identified as male, and 17 (~5.8%) identified as non-binary or third gender. 9 respondents (3.1%) preferred not to disclose their gender identity.


Mental Health Resource Usage and Awareness
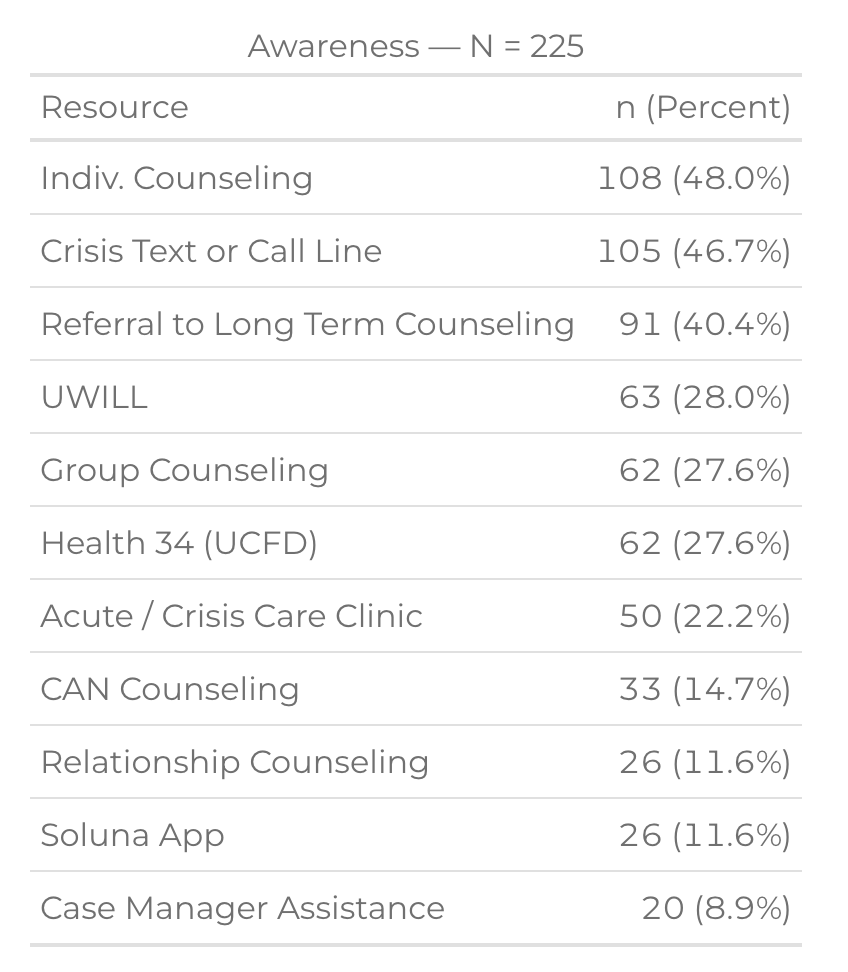
Finding #4: Students are most aware of the Individual Counseling through SHCS, and least aware of Case Manager Assistance.
Among the 225 respondents to this question, there were no categories where over 50% of respondents were aware of a single resource, with the maximum being 48% aware of individual counseling. The lowest awareness was for Case Manager Assistance, with approximately 9% of respondents aware of this resource.

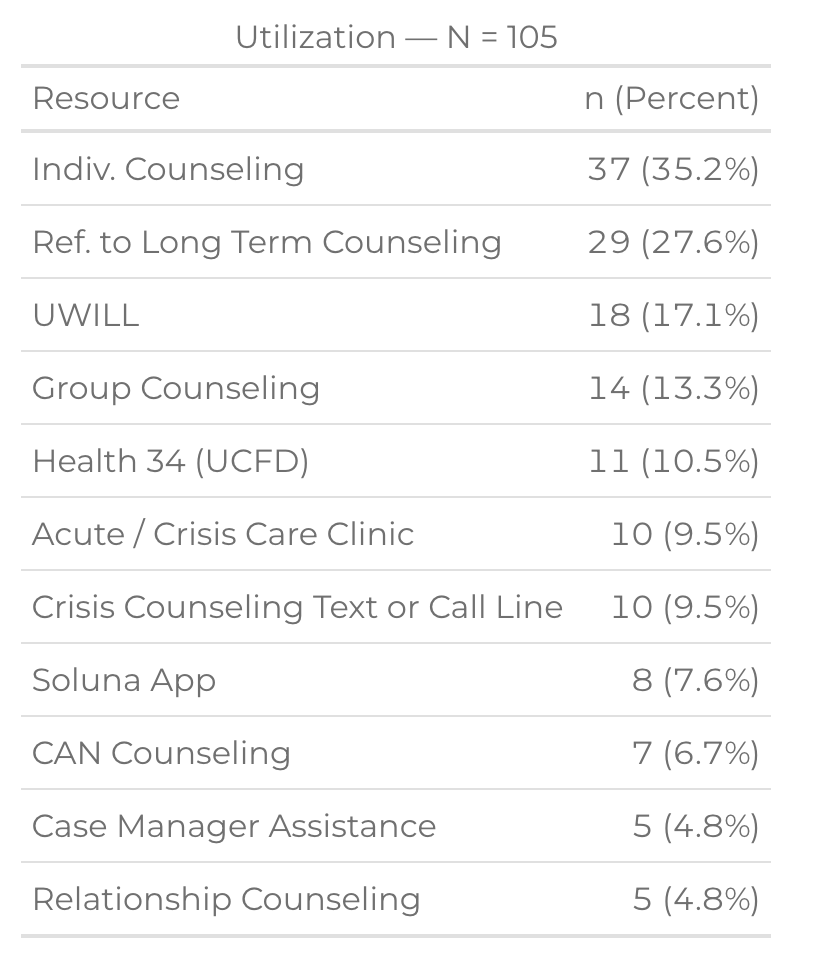
Finding #5: Students utilize the Individual Counseling through SHCS the most, and utilize the Relationship Counseling and Case Manager Assistance the least.
Among the 105 respondents to this question, the highest utilization rate was 35.2% for Individual Counseling, and the lowest approximately 5% for Case Manager Assistance and Relationship Counseling. Only 105 of 295 total respondents answered this question about utilizing resources, or approximately 36%.

Finding #6: Students have the largest gap from awareness to utilization for the Crisis Text and Call Line.
Among the 225 respondents to the awareness question and 105 respondents to the utilization question, the highest gap between awareness and utilization was for the Crisis Text and Call Line, with almost 40%. The smallest gap between awareness and utilization was for Soluna App, with less than 5%.

Finding #7: Students learned the most about Mental Health Resources through On-Campus Presence and Social Media.
Among the 260 respondents to this question, the highest percentage of respondents learned about resources through on campus presence, with 46.5%. Then, 34% by social media, 27% by self research, 26.5% by word of mouth, and almost 15% were not aware of any resources.


Mental Health Treatment
Finding #8: Approximately 70% of respondents have not received or requested mental health treatment in the past year.
Out of the 291 students who responded to this question, 71% of respondents reported not receiving or requesting mental health treatment in the past year, with 29% receiving or requesting mental health treatment.


Finding #9: Most respondents who reported not receiving or requesting mental health treatment in the past year said it was due to “No Need”, with 20% of responses being “Time Conflicts/Too Busy”.
When asked why they didn’t request or receive mental health treatment, 67% of respondents reported having “No Need”. However, the most common reasons beyond “No Need” were time conflicts or being too busy with 24.8%, and also concern about the cost of care with 16%.


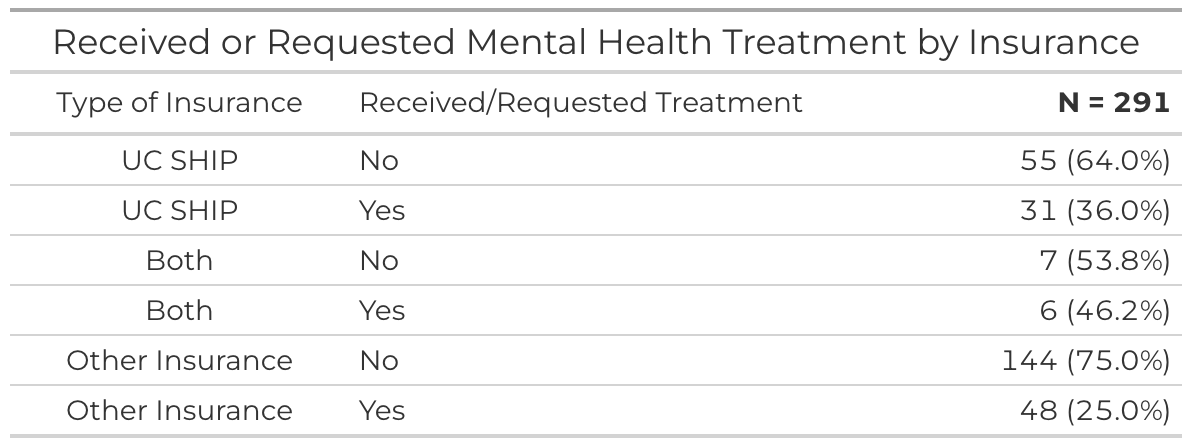
Finding #10: A higher proportion of UC SHIP enrollees receive or request mental health treatment compared to respondents who have opted out and have another insurance.
When comparing the proportion of respondents who received or requested mental health treatment in the past year by insurance type, there is a higher proportion of students who receive or request mental health treatment when they are enrolled in UC SHIP compared to students who have opted out and have another insurance. 36% of UC SHIP enrollees received or requested mental health treatment as opposed to only 25% for students with another insurance plan.

Finding #11: Proportion of receiving or requesting mental health treatment varies across gender.
The proportion of receiving or requesting mental health treatment varies across gender, with 30.7% of female respondents reporting receiving or requesting mental health treatment in the past year and only 17% of male respondents reporting receiving or requesting mental health treatment in the last year.


Finding #12: Approximately 40% of transfer students reported receiving or requesting mental health treatment, while only roughly 30% of non-transfer students did.
A higher proportion of transfer students, 39.7% of respondents, received or requested mental health treatment compared to non-transfer students, 26.8% of respondents.


Insurance Satisfaction
Finding #:13 Approximately ⅔ of respondents opt-out of UC SHIP.
Out of 294 respondents, 194 (~66%) opted-out of UC SHIP and used alternative insurance. 100 (~34.4%) respondents are enrolled in UC SHIP, with 87 being enrolled in only UC SHIP and 13 being enrolled in both.


Finding #14: Approximately 69% of respondents have experienced at least one issue with their insurance.
Out of 295 respondents, 205 (~69%) selected at least 1 issue with their insurance while 90 (~31%) did not. It is noted that several respondents selected the “Other” insurance issue type and reported “none” or “n/a” when asked which other insurance issue they experienced. These respondents were marked as not reporting any insurance issues for accuracy.


Finding #15: Long wait times are the most prevalent reported insurance issue.
Out of the 205 respondents who selected at least 1 issue, nearly half of them (101~49.3%) reported long wait times. A little over ¼ of respondents reported experiencing changing policies and/or coverage as an issue. 30 respondents (~14.6%) reported insufficient payouts. 21 respondents (~10.2%) reported denied claims.


Finding #16: Respondent insurance satisfaction is right skewed.
289 respondents selected an option on the Likert scale to represent their satisfaction with their insurance. Approximately 57% of respondents were somewhat or extremely satisfied with their insurance. 29% of respondents felt neither satisfied or dissatisfied, while only 13.5% of respondents were somewhat or extremely dissatisfied. It is noted that ratings generally tend to be right skewed.


Finding #17: Distribution of insurance satisfaction varies depending on whether respondents reported insurance issues.
Out of the 205 respondents who reported at least 1 issue with their insurance, 55% were somewhat or extremely satisfied while 65% of respondents who did not report any issues were somewhat or extremely satisfied. Additionally, 23% of those who reported at least 1 issue were somewhat or extremely dissatisfied, while only 2% of respondents who did not report any issues were somewhat or extremely dissatisfied. Performing a Mann-Whitney U Test on the binary variable for whether respondents reported at least 1 issue and the satisfaction rating, the p-value produced was 0.006296. Therefore, we reject the null hypothesis that the distribution of insurance satisfaction is equal for respondents who reported at least 1 issue and respondents who did not report any issues.
With further exploration in each type of insurance issue, a Mann-Whitney U test was specifically performed on the satisfaction rating of respondents and a binary variable for whether they reported the specific issue or not. Four tests were performed on the comparison of satisfaction rating and whether long wait times, denied claims, changing policies and/or coverage, or insufficient payouts were reported as an issue. Out of these tests, it was found that the difference in distributions for insurance satisfaction and denied claims was statistically significant. This suggests there are significant differences in the impact of different insurance issues.


Finding #18: Insurance issues for UC SHIP and alternative insurances remain constant.
The proportions of each type of insurance issue being reported were extremely similar for respondents who opted-out of UC SHIP and use an alternative insurance compared to respondents who were enrolled in UC SHIP. For this analysis, respondents who were enrolled in both UC SHIP and an alternative insurance were left out.


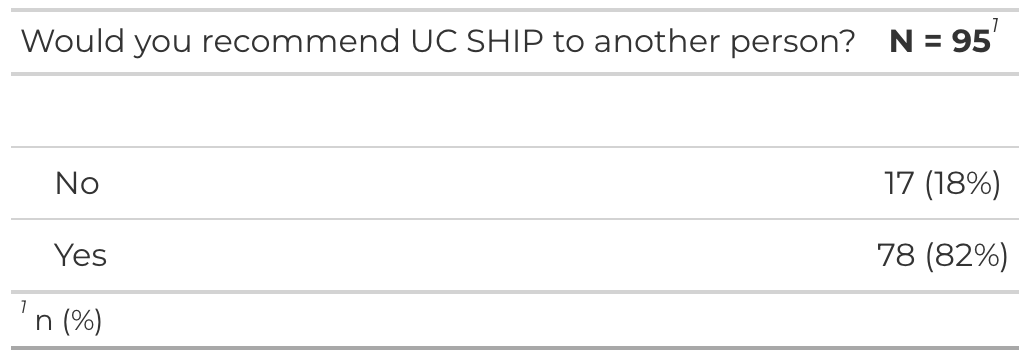
Finding #19: A strong majority of respondents enrolled in UC SHIP would recommend it to others.
Out of the 100 respondents who were either only or jointly enrolled in UC SHIP, 95 answered the question asking whether they would recommend UC SHIP to another person. 78 respondents (~82%) selected yes. Less than ⅕ of respondents (17~18%) would not recommend UC SHIP to another person.

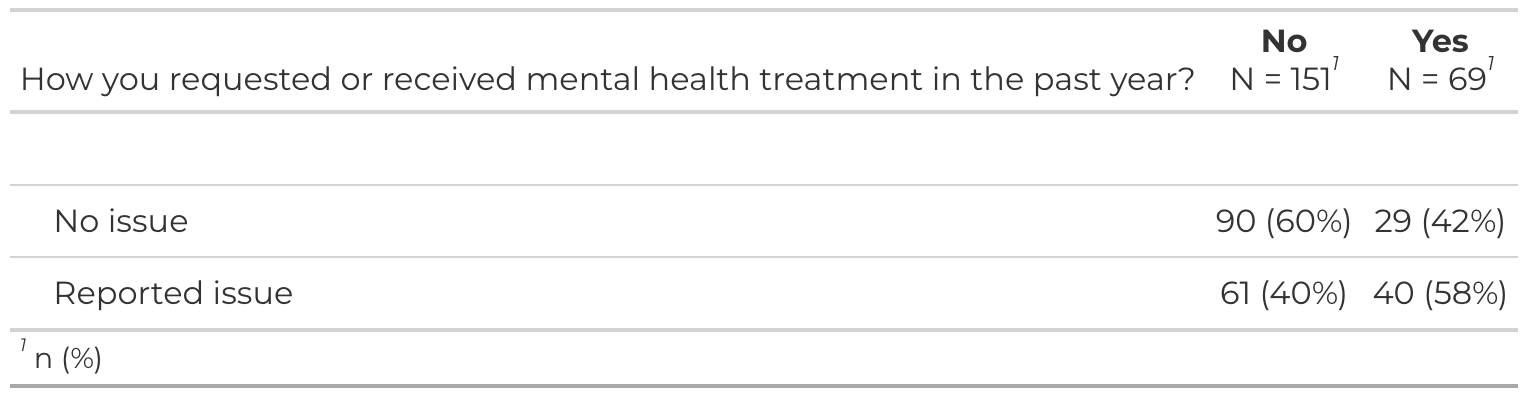
Finding #20: A higher proportion of respondents who have requested or utilized mental health treatment in the past year reported long wait times.
Out of the 69 respondents who requested or received mental health treatment in the past year, 40 (~58%) reported experiencing long wait times. 61 (~40%) of the 151 respondents who did not request or receive mental health treatment in the past year reported experiencing long wait times.
Performing a Mann-Whitney U test between whether a respondent requested or received treatment and whether a respondent reported a certain type of insurance issue, the p-values for long wait times, denied claims, and changing policies/coverage were approximately 0.015, 0.093, 0.071, and 0.503, respectively. At a 95% confidence level, we are able to reject the null hypothesis that the distributions of respondents who reported requesting or receiving mental health treatment in the past year did not have the same pattern of reporting specifically long wait times as respondents who did not seek treatment.

Conclusion & Recommendations
In conclusion, every resource had an awareness rate of less than 50% among respondents. More emphasis could be placed on resource education to ensure students are more aware of the mental health resources on campus. Students utilize individual counseling the most, so funding could be more focused on that. Additionally, most students learned about resources through on-campus presence social media, showing that tabling and online efforts to advertise are successful, yet could still improve as each reached less than 50% of respondents.
A significant portion of the student population does not seek or receive mental health treatment due to lack of time and also concerns over cost. Most respondents reported not receiving or requesting mental health treatment due to “No Need”. However, 24.8% of respondents reported “Time Conflicts/Too Busy” and 16% of respondents reported “Concern About Cost” being reasons for not receiving or requesting mental health treatment.
Insurance issues are prevalent amongst most survey respondents, with 69% reporting having at least one issue with their insurance plans. Denied claims were seen to have a significant effect on insurance satisfaction amongst survey respondents, and a higher proportion of students receiving or requesting mental health treatment experienced long wait times.
In general, many respondents are unaware of current UC Davis mental health resources, with many students worrying about lack of time and cost of care when choosing not to seek mental health treatment. However, 80% of respondents enrolled in UC SHIP reported that they would recommend it to another person.
Recommendation #1: Advocate for improved access to mental health treatment and provide interim resources.
Long wait times were the most common type of insurance issue among respondents of both alternative insurance and UC SHIP, and they were disproportionately experienced by students who requested or received mental health treatment in the past year. At the same time, a strong majority of UC SHIP users reported being satisfied with their insurance to the point of recommending it to others. This indicates that UC SHIP is not a primary barrier to care, but that there is limited support relative to student demand. Because reducing wait times is a complex and systemic issue, we recommend expanding and more actively promoting interim support options to help students while they wait for further treatment. Improving visibility of these interim resources while waiting may help address certain gaps in resource awareness, especially since respondents reported being much more familiar with individual counseling and long-term referral options compared to other counseling services such as group or CAN counseling.
Recommendation #2: Advocate for more resource education campaigns for more students to be aware of what is offered.
For every mental health care resource offered on campus, there is less than a 50% awareness rate for each one, showcasing the need for more resource education across campus to raise awareness amongst the student population. Additionally, the third most reported reason for not receiving or requesting mental health care amongst respondents was, “Concerned about cost”, with 16% of responses reporting that as a reason, showcasing the lack of knowledge about free mental health care resources on campus such as Short Term Individual Counseling through SHCS. Lack of awareness is a barrier in students receiving appropriate mental health care, so it is important that there are more programs in place to help students access the care they need. This can be done through in-person events, tabling, or social media campaigns that highlight free or low-cost resources for students, as those two channels are where students are most often accessing information about mental health care resources.
Appendix
Appendix A: Pre-survey Prerequisites
This survey aims to gather transparent information and opinions about UC SHIP and Mental Health Resource Awareness at UC Davis.
All information collected will be kept confidential and will not be shared outside of the Associated Students of the University of California, Davis (ASUCD), unless specified otherwise. The findings from our research may be presented in the form of presentations and publications, but no personally identifiable information will be disclosed. Your data will be stored securely on Qualtrics and the researchers' computers. Your participation is voluntary, and you may withdraw at any time without penalty. If you have any questions or concerns about the survey or the use of your data, please contact [email protected].
Appendix B: Survey Questions
- Are you enrolled in UC SHIP (University of California Student Health Insurance Plan)?
- I am enrolled for UC SHIP.
- I opted out and have another insurance.
- I have both UC SHIP and another insurance.
- Which of the following free mental health resources at UC Davis are you aware of?
- Referral to Long Term Counseling
- UWILL - Free 30 minute Telehealth Sessions through SHCS
- Free Short Term Individual Counseling through SHCS
- Group Counseling through SHCS
- Soluna App
- Health 34 (Non-emergency support and service navigation through the UC Davis Fire Department)
- Acute / Crisis Care Clinic (Same-Day Mental Health Crisis Appointments through SHCS)
- Case Manager Assistance through SHCS
- Relationship Counseling through SHCS
- CAN (Community Advising Network) Counseling (Through the Women’s Resource Center, LGBTQIA Resource Center, etc.)
- Crisis Counseling Text or Call Line
- Other: [Free Response)
- Which of the following free mental health resources at UC Davis have you utilized?
Note: SHCS (Student Health and Counseling Services)- Referral to Long Term Counseling
- UWILL - Free 30 minute Telehealth Sessions through SHCS
- Free Short Term Individual Counseling through SHCS
- Group Counseling through SHCS
- Soluna App
- Health 34 (Non-emergency support and service navigation through the UC Davis Fire Department)
- Acute / Crisis Care Clinic (Same-Day Mental Health Crisis Appointments through SHCS)
- Case Manager Assistance through SHCS
- Relationship Counseling through SHCS
- CAN (Community Advising Network) Counseling (Through the Women’s Resource Center, LGBTQIA Resource Center, etc.)
- Crisis Counseling Text or Call Line
- Other: [Free Response)
- How did you learn about these resources?
- Social Media
- Self Research
- On-Campus Presence
- Word of Mouth
- Other: [Free Text]
- I am not aware of any of the listed resources.
- Have you received or requested mental health treatment in the past year?
- Yes
- No
- [If no to receiving/requesting mental health treatment] Why have you not received mental health treatment in the past year? (multi-select)
- No need
- Concerned about cost
- Social Taboo
- Lack of trust in confidentiality
- Lack of trust in quality of treatment.
- Time conflicts/Too Busy
- Other: [Free Text]
- How satisfied do you feel with your experience with your insurance provider
- Very Unsatisfied
- Somewhat Unsatisfied
- Neutral
- Somewhat Satisfied
- Very Satisfied
- Which of the following issues have you experienced with your insurance or medical providers?
- Denied claims
- Insufficient payout
- Long wait times
- Changing policies and/or coverage
- Other: [Free Response]
- [If enrolled in ship] Would you recommend UC SHIP to another UC Davis student?
- Yes
- No
Demographics
- Which year did you start at UC Davis?
- Before 2022 or 2022
- 2023
- 2024
- 2025
- Are you a transfer student?
- Yes
- No
- What is your gender identity?
- Male
- Female
- Non-binary
- Other: