


ASUCD Unit Workplace Experience Report 2025
Introduction & Objectives
The Associated Students of the University of California, Davis (ASUCD) is the largest employer of UC Davis students on campus, providing employment opportunities across numerous units, including the coffee house, bookstores, buses, and administrative offices. As a major campus employer, ASUCD plays a crucial role in shaping the student experience at UC Davis — not only for its employees, but for the broader campus community who interact with ASUCD services daily.
Student employment serves multiple purposes, besides financial support. For many students, their ASUCD job represents their first professional experience, providing opportunities to learn-on-the-job, connect with fellow students, and build out their resumés. Therefore, the quality of these experiences can significantly impact students' academic, social, and professional success.
By allowing ASUCD employees to voice their opinions about their workplace, we aim to assess what is going well and where improvements are needed. This will allow ASUCD to make data-backed decisions, ensuring the continued success and well-being of their employees.
Methodology
Data Collection
The Employee Satisfaction survey was distributed through Qualtrics, and all responses were collected anonymously. To facilitate data collection, all Unit Directors were messaged directly and instructed to distribute this questionnaire to their employees. This survey was not made publicly available to ensure only ASUCD employees were considered.
Data Processing
All data was cleaned and analyzed using the R programming language. Cleaning consisted of removing survey responses submitted within 60 seconds of beginning the survey — we believe that these responses weren’t thoughtful and should therefore be excluded. This decision is based on the distribution of response times, which can be observed as approximately normal. Responses that fell 2 standard deviations below the mean were removed, representing approximately 2.5% of responses.
Data Analysis
Methods of Analysis
This report utilizes a variety of visualization and statistical techniques. To understand frequency of responses and relationships quickly, visualizations such as bar graphs and tables were used. This includes univariate analysis and bivariate/multivariate analysis.
Outside of descriptive statistics, the majority of statistical methods used in this report are non-parametric, meaning they carry less assumptions about the distribution of responses/residuals for each question. Non-parametric methods do not assume the data follows a normal distribution, and are less sensitive to Type-I errors for questions with small sample sizes.
Additionally, these methods are appropriate for ordinal data. Most of the questions in this survey ask respondents to rank their agreement/disagreement on a 5-point ordinal scale. In this case of disagree-agree questions, the data is diverging, meaning there is a natural midpoint (neither agree nor disagree). These are examples of Likert-scale questions. Parametric methods cannot be used with ordinal data. While the ranking follows a clear order, the distance between two adjacent points cannot be assumed. In other words, some students may respond ‘agree’ where others would say ‘strongly agree’, though their true underlying agreement is the same. For that reason, specialized methods are required.
The non-parametric methods used include:
- Wilcoxon Rank Sum Test: used to determine whether survey response distributions differ between two independent groups. This is used as an alternative to a 2-sample t-test when parametric assumptions are violated (as is the case with ordinal data).
Packages utilized include the tidyverse library (including ggplot and dplyr), gt and gtsummary, psych, rstatix, and coin. For all hypothesis testing, a significance level of ɑ = 0.05 was used. This value corresponds to the probability of committing a Type I error, and is the cutoff used to determine the significance of a p-value.
Overall Satisfaction
Finding #1: ASUCD Unit Employees are generally satisfied with workplace experiences.

First, we take a general overview of satisfaction across four primary facets: work hours and scheduling, pay rates, operational execution, and emotional fulfillment. Across all units, respondents indicate that they are generally satisfied with their workplace experience, with the majority of responses indicating either agree or strongly agree across all four dimensions.
The following report breaks down analysis to a more granular level (unit, primary title, and tenure), highlighting how both satisfaction and dissatisfaction vary across scheduling, workplace environment, and responsibilities and training.
Scheduling / Work Hours
Finding #1: ASUCD Employees are generally satisfied with their scheduling

Findings show a general satisfaction with scheduling, as 83.1% of respondents strongly agreed or agreed that they are satisfied with the timing of their work hours. Additionally, 82.7% respondents strongly agreed or agreed that they have enough flexibility to adjust their work hours when needed. In terms of the ability to maintain work-life balance, 79.0% of respondents strongly agreed that their current work hours allowed for a healthy balance. 72.4% strongly agreed that situations where they're asked to work beyond allocated hours are properly managed and do not negatively impact well-being, and 85.5% of respondents strongly agreed or agreed that they're receiving the proper number of breaks during their shifts.
Finding #2: Employees who would like more work hours are more likely to be STDT 3 or have 3-4 years of tenure


Though these results do not achieve statistical significance due to a small sample size, they are interesting. It appears as though employees who have worked for ASUCD for longer periods (especially those in STDT 3 positions and those who have been at their jobs for 3-4 years) appear to feel that they are being underscheduled.
Finding #3: Employees are able to advance their student titles at a reasonable pace

The average ASUCD employee with a tenure of 3-4 years is highly likely to have a STDT 4 position, while the average employee with a tenure of one quarter is highly likely to have a STDT 2 position. This indicates that ASUCD employees are able to be promoted along a reasonable timeline during their school career.
Finding #4: Coffee House employees are less satisfied with their scheduling than other units
In our initial data analysis, it appeared that Coffee House/CoHo South Cafe (CoHo) employees were less satisfied across several dimensions of their work hours. To test this hypothesis, we broke responses into two groups — CoHo employees and non-CoHo employees — and conducted the Wilcoxon Rank-Sum test (a non-parametric statistical test). This allowed us to assess whether these groups responded differently to the same statements about scheduling below. We found that CoHo employees tended to be less satisfied across all of these statements. However, the effect sizes ranged from moderate (S1, S2, and S5) to small (S4 and S6). As higher effect sizes indicate more significant dissatisfaction from CoHo employees, it would be prudent to focus on flexibility of work hours and work-life balance especially, when considering ways to improve workplace satisfaction.
In the table below, responses to each statement were recoded as numbers:
1 = “Strongly disagree” through 5 = “Strongly Agree”. We then calculated average satisfaction across questions, shown as means within the table below. Note that these are only useful heuristics — because the data is ordinal, we cannot compute the exact difference in satisfaction between groups.

In the suggestions section, CoHo employees repeatedly stated that their scheduling doesn’t feel “student-friendly”. They cited a lack of buffer time before classes and a strict strike system in which three missed days without a doctor's note / proof of emergency would lead to termination. CoHo employees also repeatedly suggested a shift preference system, allowing them to choose between early and late shifts. Lastly, students who had higher titles (STDT 3 or STDT 4) reported not receiving enough hours, while students with lower titles (STDT 2 and STDT 1) reported scheduling confusion and a lack of shift flexibility.

The data backs this up. The above graph shows responses to “Which of the following statements best describes your current work hours? (Select One)” across student employee levels. Coffee house employees with STDT 3 and STDT 4 level employment answered that they don’t work enough hours at a much higher rate than students with STDT 1 and STDT 2 employment.
Work Environment Satisfaction
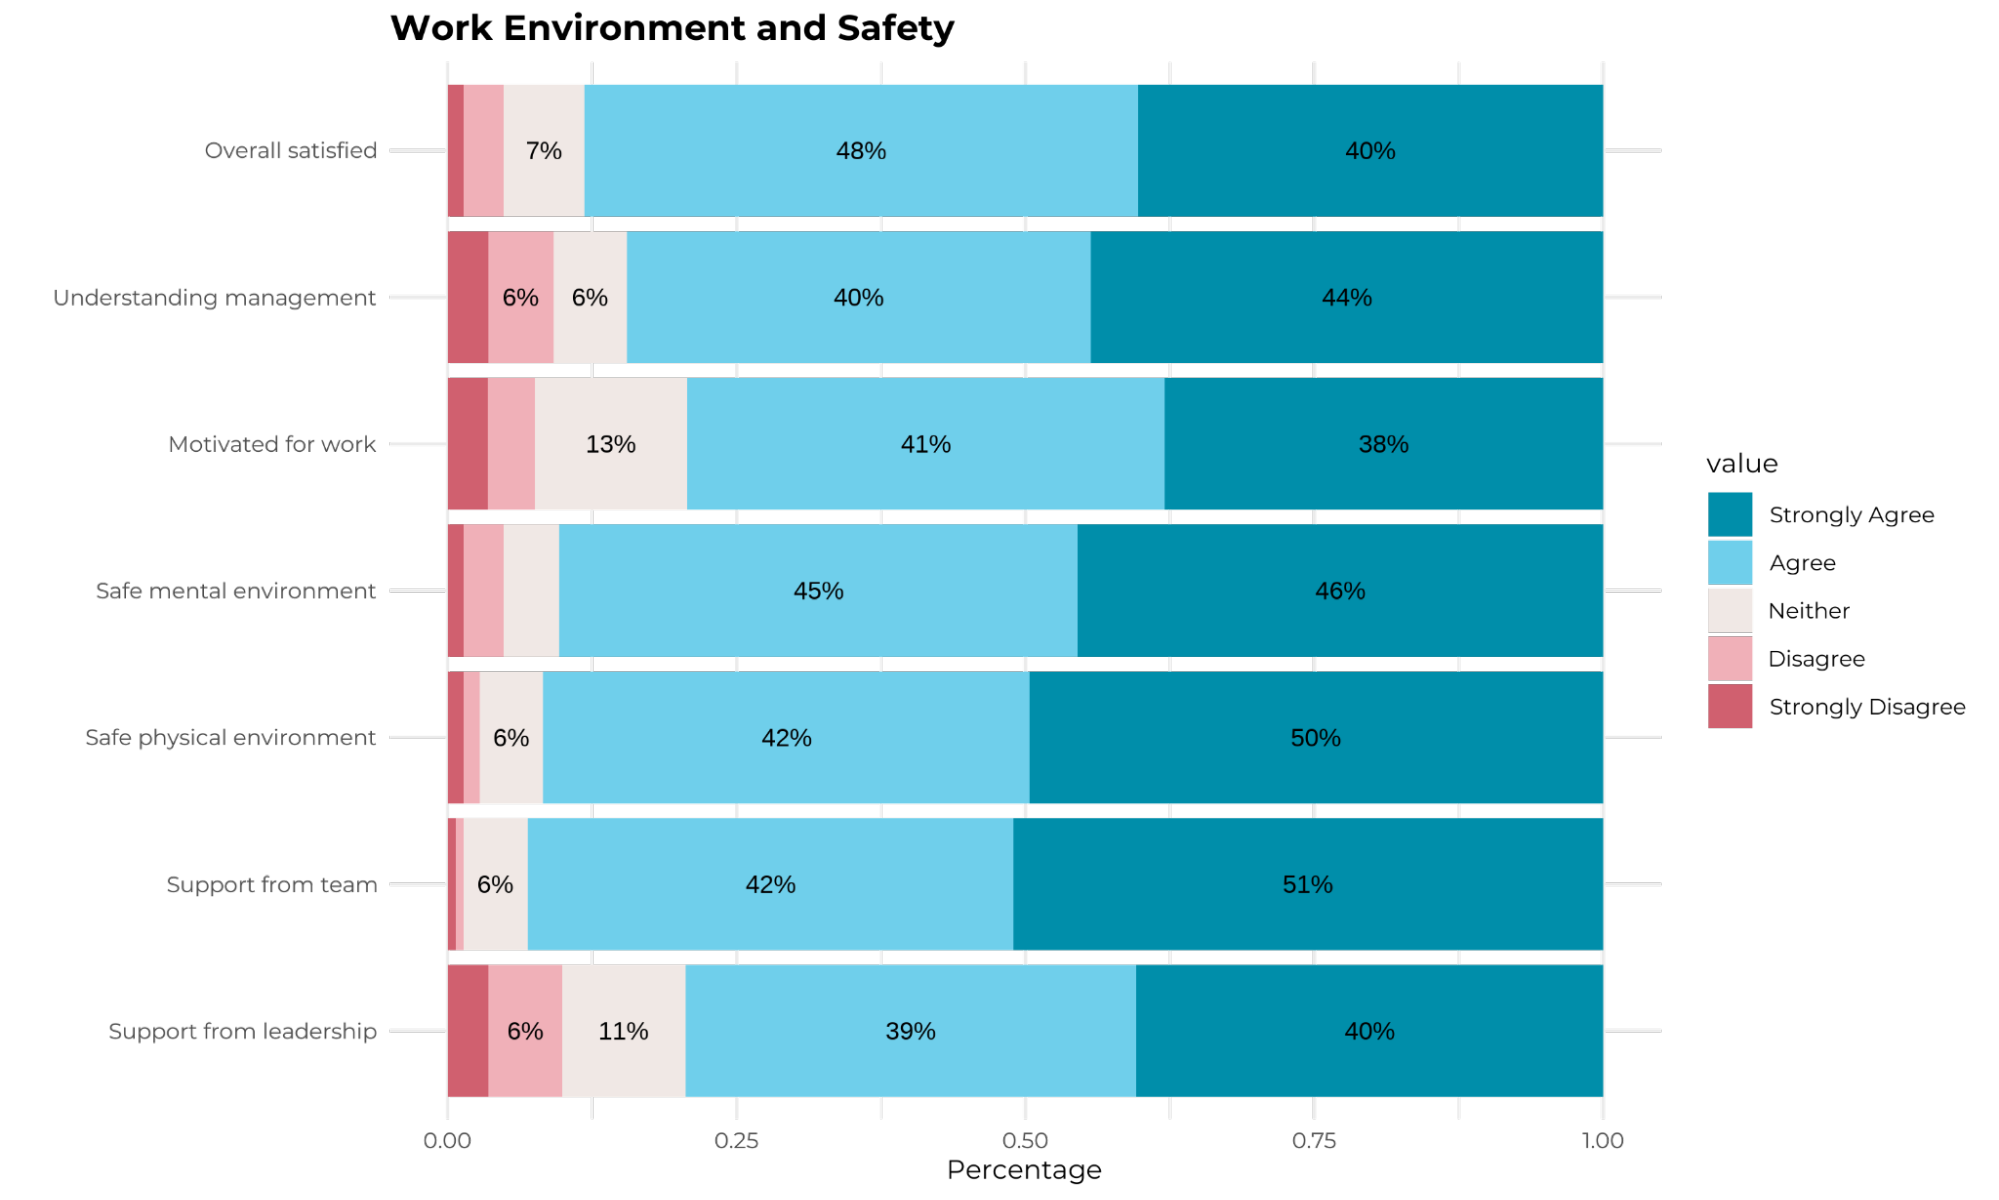
Finding #5: Lack of support from leadership and management is the area of most dissatisfaction. These concerns are especially prevalent in COHO employees, employees with tenure of 2-4 years, and employees of primary title STDT 3.

While the majority of respondents reported being satisfied with their work environment overall, two statements received a higher percentage of disagree and strongly disagree responses. 9.93% of respondents disagree or strongly disagree that they are satisfied with the support and collaboration they receive from leadership, and 9.15% disagree or strongly disagree that management is understanding and accommodating of their academic workload or commitments.

When breaking this down by Unit: 25% of WEF disagree or strongly disagree, 22% of COHO, 14.3% of KDVS, and 12.5% of Aggie Reuse (note that all except COHO have only 1 response in disagree/strongly disagree, proportionate to the number of respondents per Unit as related to Unit size).

Once again, certain units see a higher rate of dissatisfaction with support from management or leadership, with 26.2% of COHO, 25% of WEF, and 7.1% of Creative Media reporting that they strongly disagree or disagree with the statement of management being supportive regarding academic workload or commitments.

Now, breaking down responses by tenure, we find that students working for ASUCD for 2-3 years had the highest dissatisfaction with support from leadership, with 26% of respondents disagreeing or strongly disagreeing that they are satisfied with the support and collaboration they receive from leadership. Additionally, 21% disagree or strongly disagree that management is understanding and accommodating of their academic workload or commitments. Regarding students of longer tenure, 18% of students working for ASUCD for 3-4 years were overall dissatisfied with their work environment, including support, safety, and motivation; 27% are dissatisfied with support from leadership.

Furthermore, breaking down work environment satisfaction by primary title: 200% of STDT 3 employees disagree that management is understanding, and 27% disagree that they are satisfied with the support and collaboration they receive from leadership.
Finding #6: Text entries from respondents suggest Coffee House employees are less satisfied with work environment overall, as compared to other units.
From text suggestions and entries, we find that CoHo respondents’ main concerns with work environment satisfaction come from scheduling flexibility, injury from physical labor, and management and employee relationships. Respondents also propose suggestions for improvement, including anonymous feedback forms.
Finding #7: Text responses suggest most people are generally satisfied with their work environment and safety. Those who are not satisfied have similar concerns across all available units.
Respondents across units note the community, teams and coworkers, as the primary benefit of their position. Across all units, dissatisfaction seems to primarily stem from scheduling flexibility and collaboration between management and employees. Suggestions proposed by respondents include incorporating incentives (awards, events, better hours), increasing scheduling flexibility, and promoting communication between supervisors and employees.
29 respondents indicated having concerns, but not sharing them with their supervisors. Reasonings include believing that nothing would change, fear of outing themselves, social anxiety, and believing that their concern was not significant enough to share. However, out of the 84 respondents who did bring up workplace concerns with their supervisor, 90.47% felt their feedback was addressed.
Responsibilities and Training
Finding #1: Employees generally feel prepared for their role.

When prompted with the statement “I feel prepared for my role and know what is expected of me,” respondents across all units generally indicate strongly agree or agree. Few units host respondents reporting disagree, and even fewer strongly disagree. In fact, only one unit had an employee report strongly disagree: Creative Media.
Finding #2: Creative Media employees appear to be less satisfied with their training programs than other units.

When prompted with the statement “My training program adequately prepared me for my role,” several units report comparably negative responses, particularly WEF, CoHo, and Creative Media. Creative Media in particular reports the highest count of strongly disagrees, indicating a potential dissonance between employees and management in the training process.
Conclusion & Recommendations
This assessment of workplace experience within ASUCD shows that student employees are largely satisfied with their roles, but improvements could be made in scheduling (especially of longer-term employees) as well as manager support and communication, including programs for key units.
Recommendation #1: Improve larger unit scheduling
For larger unit scheduling, emphasize shift preferences, allowing students to offer input on whether their shifts begin earlier or later. Additionally, open communication channels to ensure that employees with longer tenure are not feeling under-scheduled.
Recommendation #2: Increase candid communication between management and employees
Bridging the gap between employees and management for all units will allow students to feel more motivated to come to work, share any concerns they may have, and feel better supported overall. Student suggestions here highlight routine feedback forms as a potential tool.
Recommendation #3: Instate standardized, comprehensive training programs and role expectations
Clearly define and maintain role expectations, providing standardized and comprehensive training that fully prepares individuals for all tasks.
Appendix
Appendix A: Additional Tables


Appendix B: Additional Figures
Appendix C: Survey Questions
Consent:
This survey aims to gather information and opinions about your work experience in ASCUD. Your participation is completely voluntary.
Data collected will be used for research and analysis by the ASUCD Innovation and Research Lab (IRL) to inform ASUCD units on employee satisfaction and operations.
Data will be anonymized through indexing and will not be stored with any personally identifiable information (e.g. names, emails). Raw data will be confidentially secured and only accessible by the IRL research team.
By consenting, you agree to the following:
- I understand the purpose of this survey and voluntarily agree to participate.
- I understand that my responses will be stored securely and that no personally identifiable information will be shared in any reports, presentations, or publications.
- I understand that I can withdraw my participation at any time without penalty.
If you have any questions or concerns, please contact us at [email protected].
Do you consent to participate in the survey?
- Yes.
GENERAL
- Which ASUCD Unit are you employed with?
- Aggie Reuse
- Bike Barn
- The California Aggie
- ASUCD Campus Center for the Environment & ASUCD Community Gardens
- Coffee House/CoHo South Cafe
- Creative Media
- Entertainment Council
- Housing Advising for Undergraduate Students (HAUS)
- Information Technology (IT)
- Innovation and Research Lab
- KDVS
- Mental Health Initiative (MHI)
- The Pantry
- Picnic Day
- Pride Festival
- Student Health and Wellness
- Unitrans
- Whole Earth Festival
- Office of the External Affairs Vice President
- Office of the Transfer Student Representative
- Office of the International Student Representative
- Student Advocate's Office
- What is your Primary Title?
(Not sure? You can find this in your TRS or ask your supervisor)
- STDT 1
- STDT 2
- STDT 3
- STDT 4
- Other
- How long have you worked for ASUCD?
- 1 quarter
- 2 quarters
- 1-2 years
- 2-3 years
- 3-4 years
- 4+ years
WORK HOURS
- Which of the following statements best describes your current work hours? (Select One)
- I am satisfied with the number of hours I work.
- I work too many hours.
- I do not work enough hours.
- None of the above.
Please rate the following statements based on your experience:

- What would you suggest to improve the scheduling, timing, or duration of work hours?
- [TEXT BOX]
WORK ENVIRONMENT AND SAFETY
Please rate the following statements based on your experience:

- Which of the following environmental factors, if any, are you concerned with? Please describe any specific concerns and improvements you would like to suggest (Select all that apply).
- Safety
- Efficiency
- Culture
- Professional advancement
- No concern
- Other: [TEXT BOX]
- What aspects of your work environment, if any, do you find most positive or beneficial?
- [TEXT BOX]
- What would you suggest, if anything, to improve the work environment (e.g., safety, culture, motivation, etc)?
- [TEXT BOX]
- If you have had concerns about your workplace, have you brought them up to your supervisor, manager, or director?
- Yes
- Did you feel that your feedback was addressed? Why or why not?
- [TEXT BOX]
- Did you feel that your feedback was addressed? Why or why not?
- No
- What influenced your decision to not share your concern/s?
- [TEXT BOX]
- What influenced your decision to not share your concern/s?
- Yes
RESPONSIBILITIES AND TRAINING
Please rate the following statements based on your experience:

- Please elaborate on any of the previous three answers
- [TEXT BOX]
SATISFACTION RATINGS
- Please rate your overall satisfaction in the following areas:

- Please elaborate on any of the previous 4 answers
- [TEXT BOX]