


GASC Student Experience Survey 2025
Data Visualizations of Student Gender and Sexuality Experiences
Introduction & Objectives
The ASUCD Gender and Sexuality Committee (GASC) seeks to understand the lived experiences, resource needs, and climate perceptions of students across the spectrum of gender and sexual identities at UC Davis. This initiative aims to guide GASC’s advocacy, programming, and policy recommendations to foster a more inclusive, equitable, and affirming campus environment.
Project Objectives
The objectives of the Mobile Pantry project are as follows:
- Understanding the gender and sexuality-related issues the undergraduate student body faces.
- Assess the needs and wants of the undergraduate student body, such as what resources they utilize and which events they are interested in.
- Gather input on unmet needs and suggestions for future programming and support services.
This report presents a visualization-centered analysis of student responses from the ASUCD Gender and Sexuality Committee (GASC) Student Experience Survey. With a focus on undergraduate experiences related to gender identity, sexual orientation, and campus climate, this preliminary report highlights key trends through accessible data visualizations.
Rather than providing a full narrative or set of policy recommendations, this document serves as a snapshot of student-reported experiences, engagement patterns, and access to resources. The goal is to inform GASC’s ongoing programming and advocacy efforts through clear, visual insights that can guide deeper inquiry and future planning.
Data Findings and Visualizations
The survey was closed at 331 responses and cleaned to 277 responses which were analyzed in this report. The data cleaning consisted of removing incomplete responses and responses that took less than 30 seconds to complete. With 19 questions a respondent likely could not have read and properly answered the survey in less than 30 seconds.
Demographics Statistics

The majority of respondents, 68%, identified as cisgender women and the second largest group being cisgender men with 21%. Nonbinary and Transgender respondents are 6% and 3% respectively. Though there are more women than men enrolled in the university the respondent demographics do not perfectly align with the university undergraduate demographics. There are disproportionately more women which could influence later conclusions.

45% of respondents were Asian followed by 22% being White. Similar to the conclusions for gender, Asian students make up the largest group in terms of enrollment but the respondent racial demographics do not perfectly align with the university demographics.

Heterosexual students make up 53% of respondents. This is followed by 21%, 9%, 4%, and 3.5% for Bisexual, Queer, Lesbian, and Gay students respectively.

277 respondents disclosed their year. Approximately 31.4%, 26.4%, 19.1%, and 16.2% of respondents are 3rd, 2nd, 1st, and 4th years, respectively. Graduate students, 5th+ years, and students in the “other” year category made up only 6.9% of the respondents.
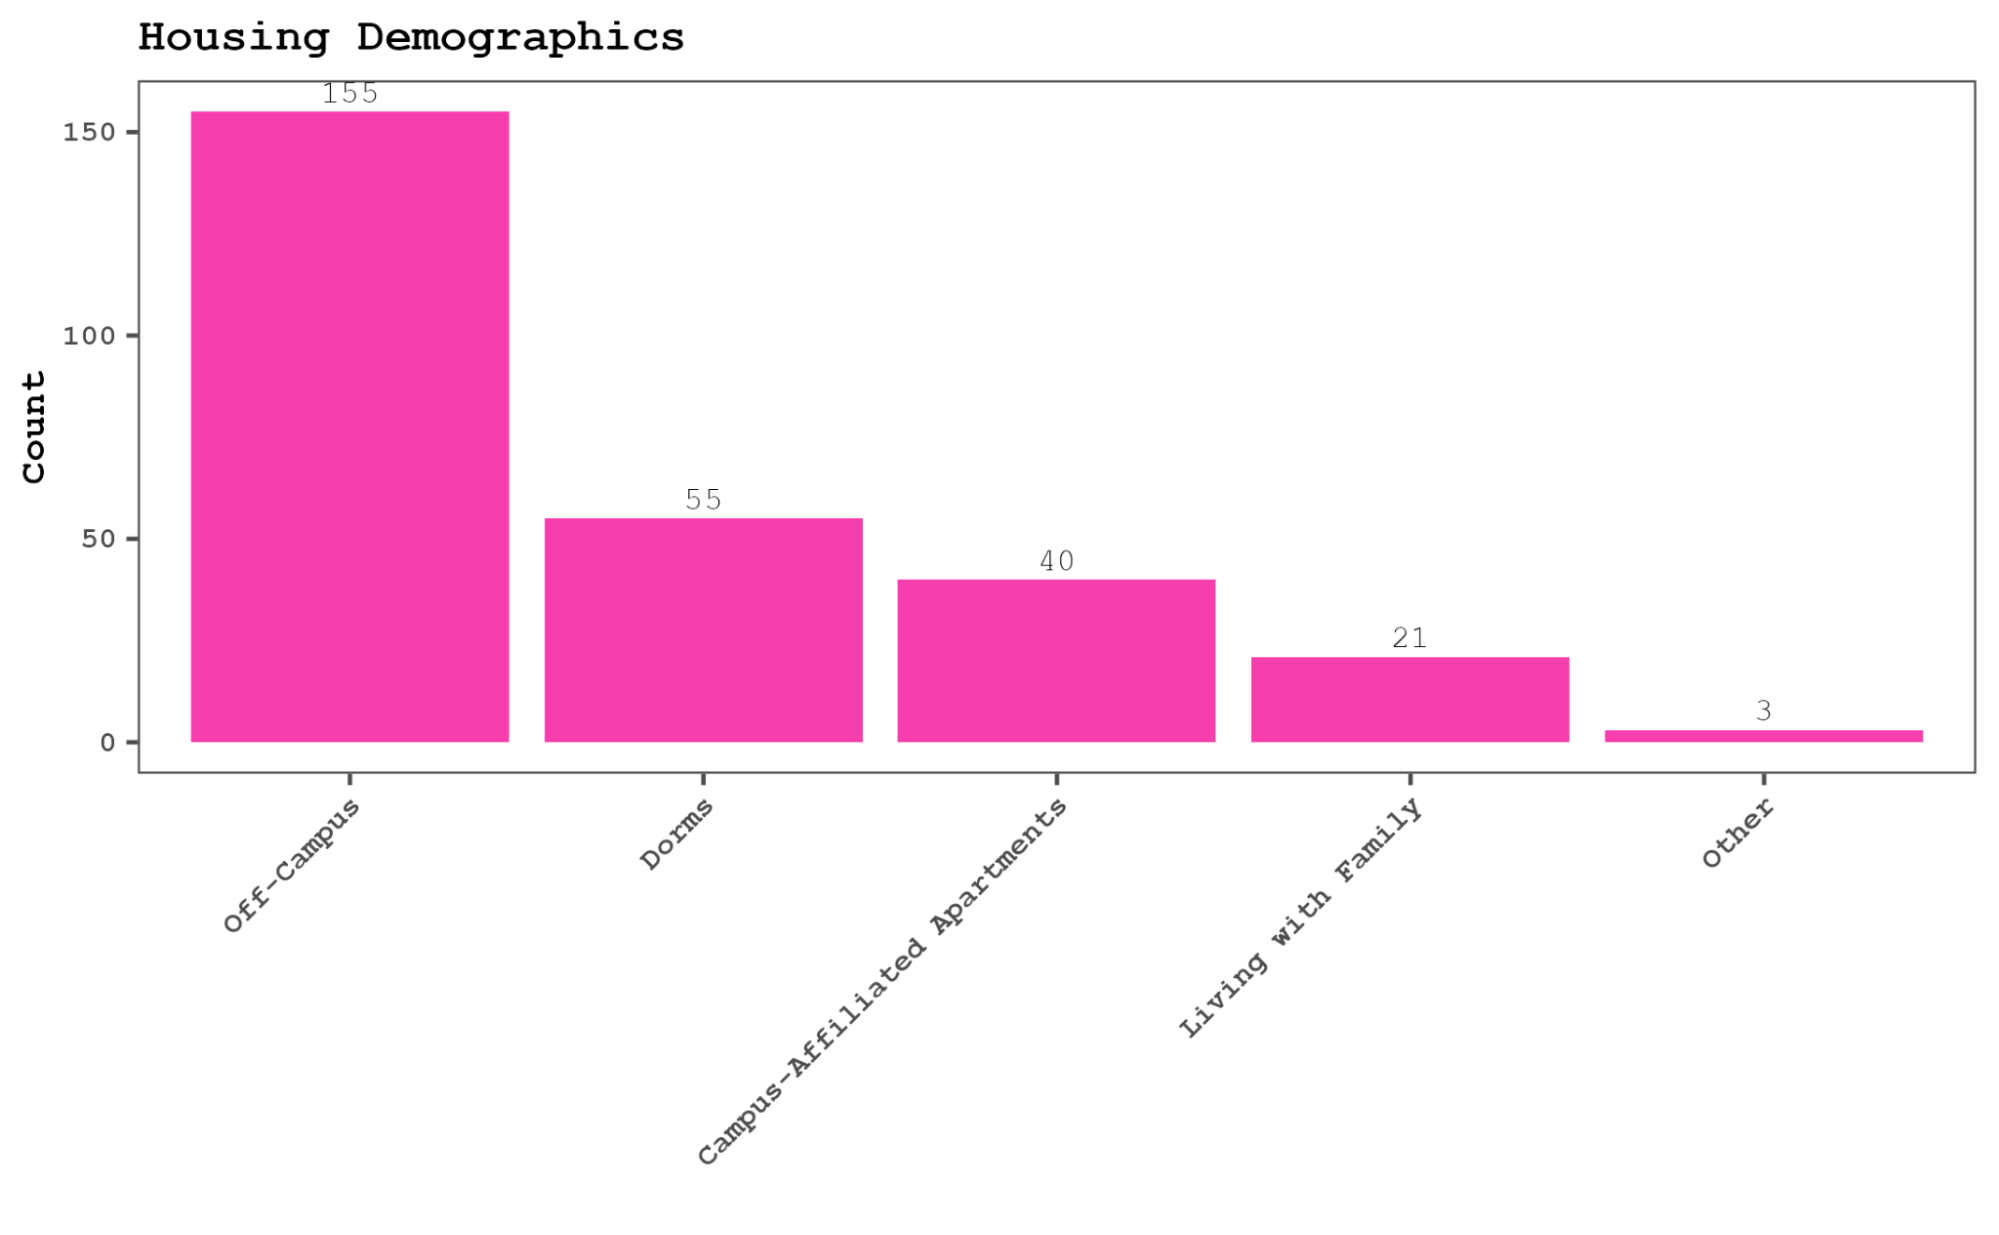
274 respondents disclosed their housing situation. Over half of respondents, 56.6%, are renting off-campus. Approximately 20.1% are living in the dorms and 14.6% are living in campus-affiliated apartments such as The Green or Orchard Park. 7.7% of respondents selected that they are living with their family off-campus. Only 1.1% of respondents selected “other” for housing. Out of these 3 respondents, only one further disclosed that they lived in the domes.
GASC Events
Finding: The majority of respondents expressed a high interest in self-defense and social events, indicating a strong preference for safety and community-building programming.

Survey respondents are most interested in attending more self-defense seminars and social events. The other six event types have between 24 and 34 percent stating that they are interested in attending.
Finding: The most common reasons for not attending events were time conflicts and being unaware of the events.

Finding: A majority of respondents prefer social media as a means of communication for GASC-related resource and event information.

Finding: While only 7% of respondents reported attending a past GASC event, interest in future participation is significantly higher, with over half of respondents stating that they are somewhat likely or very likely to attend a future event.


Resource Access
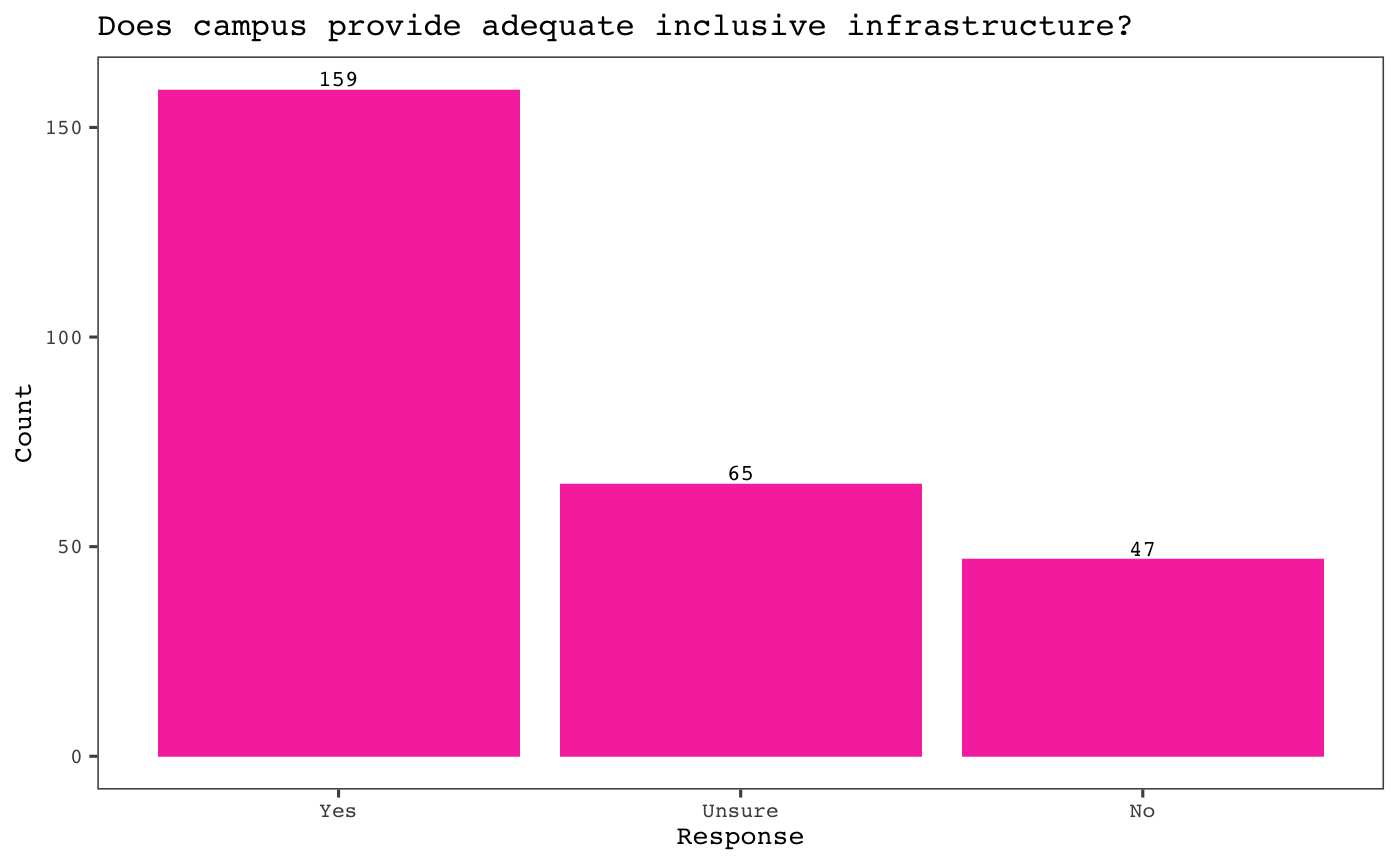
Finding: Majority of respondents believe the campus provides adequate inclusive infrastructure (gender-inclusive restrooms, gender-affirming facilities, etc.), though a notable portion remain unsure or disagree.
Out of 271 respondents to this question, approximately 58.7% of respondents selected that campus provides adequate inclusive facilities while 17.3% disagree with that statement. The remaining 24% selected that they were unsure.
Finding: Majority of respondents have not accessed any gender and sexuality related-resources at UC Davis.
79 out of 277 respondents, approximately 40% of respondents, have accessed at least one of the gender and sexuality-related resources at UC Davis.

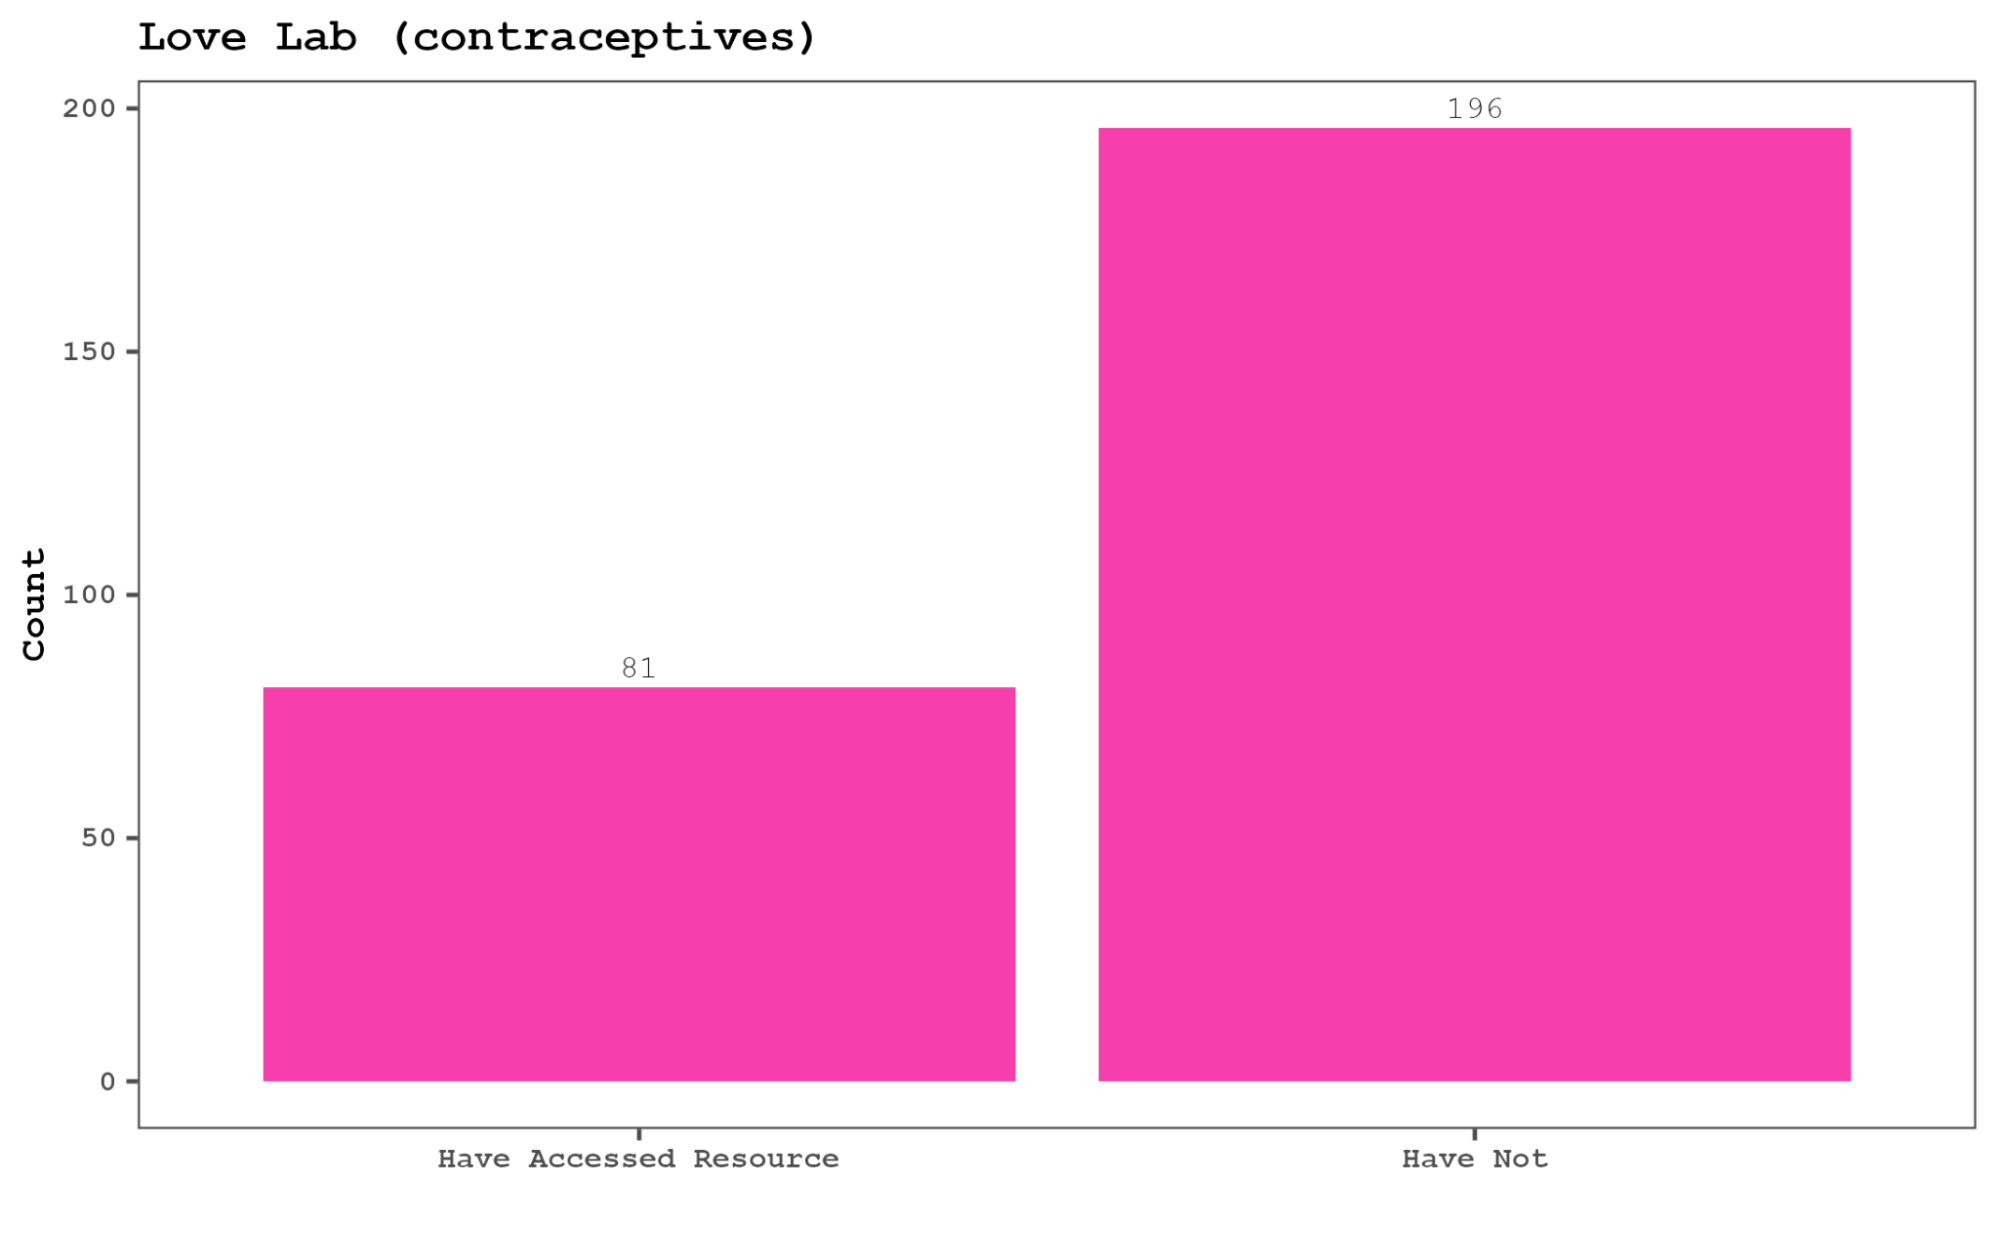
The Love Lab, Women’s Resource and Research Center (WRRC), The Pantry (menstrual products), Aggie Mental Health, Student Health and Counseling Services (SHCS), and the LGBTQIA+ Resource Center (LGBTQIA+ RC) are the most accessed resources among respondents. Histograms for each resource are included in the appendix.
Even the most accessed resources have been utilized by approximately 29.24%, demonstrating that each of the listed resources have been accessed by less than a third of respondents.

Finding: Most respondents cite lack of awareness as the reason they did not access gender and sexuality-related resources at UC Davis.
Out of 277 respondents, approximately 44% selected in a multi-select problem that there was a lack of awareness preventing them from accessing resources. 31 respondents (11.19%) selected an additional “other” reason. Respondents were given the opportunity to cite this reason in a comment box. Out of 19 respondents who gave additional comments, most stated that they felt that they did not need these resources.

Finding: An overwhelming majority of respondents in the dorms or campus-affiliated apartments would like safe sex items provided.
Out of the 95 respondents who selected that they lived in either dormitories or a campus-affiliated apartment, approximately 90.5% of respondents selected that they would like access to safe sex items in their housing community.

Campus Climate and Identity-Based Trends
Finding: A majority of respondents reported not experiencing microaggressions, though a notable portion indicated either experiencing them or being unsure.

Out of the all respondents, approximately 8% stated they had experienced microaggressions due to their gender identity or sexual orientation, while 15% were unsure, suggesting that subtle forms of exclusion may still be present and underrecognized on campus.
Finding: While most respondents did not report experiencing discrimination based on gender or sexual identity, a notable portion either experienced it or chose not to disclose.
Out of all respondents, 27 individuals reported experiencing discrimination related to their gender identity or sexual orientation on campus, with another 27 selecting “Prefer not to say”. These experiences may be underreported or difficult to share.

Finding: Most respondents feel safe on campus with regard to gender and sexuality, though a smaller portion remain neutral or feel somewhat unsafe.
Out of all respondents, 138 felt “very safe” and 85 felt “somewhat safe,” while 41 were neutral and 4 reported feeling “somewhat unsafe,” indicating that while the overall climate is perceived positively, some students still experience uncertainty or discomfort.

Appendix
Appendix A: Figures on resource access.
Graphs ordered in decreasing order of number of people who have accessed resources.


Appendix B: Figures on respondent demographics.


