



Mobile Pantry Operations and Food Insecurity Trends 2025
Survey Insights and Comparative Analysis to Enhance Food Accessibility
Introduction & Objectives
The ASUCD Pantry is a vital resource that works to address food insecurity in the UC Davis community by providing essential resources such as prepared food and fresh produce. Established in 2010 and officially launched in 2011, The Pantry has become a system for students for over a decade. Each academic year, more than 100 volunteers contribute their time to provide approximately 1,200 students with food and other essential items each week (ASUCD Pantry).
The Pantry has recently launched the Mobile Pantry––an initiative aimed at expanding food accessibility through providing various food distribution sites within the UC Davis campus. Currently, the Mobile Pantry currently serves students every Tuesday, from 11:00 AM to 1:00 PM at the Student Community Center (SCC).
As the Mobile Pantry is still in its early stages of development, this project aims to provide valuable insights that will guide its full-scale implementation. Findings from the Mobile Pantry survey will help optimize operations and improve the accessibility of resources, ensuring that the Mobile Pantry effectively meets student needs.
Project Objectives
The objectives of the Mobile Pantry project are as follows:
- Gain a deeper understanding on Mobile Pantry usage and operations by analyzing student utilization patterns, identifying accessibility barriers, and gathering recommendations to improve Pantry inventory and service offerings.
- Assess user opinions of Satellite Pantry services to identify opportunities for improvement.
- Conduct a comparative analysis of food insecurity trends by evaluating data from the 2022 Pantry survey conducted by the ASUCD Research and Data Committee (RDC) against the 2024 Pantry Survey conducted by the ASUCD Innovation and Research Lab (IRL), to evaluate the effectiveness of current initiatives in addressing food insecurity.
This report is intended to inform The ASUCD Pantry in their development of Mobile Pantry services, and the Pantry’s overall mission of addressing food insecurity and lack of basic needs in the UC Davis community.
Methodology
Mobile Pantry Survey
The Mobile Pantry survey was developed on Qualtrics and consisted of 27 questions designed aimed to collect numeric and descriptive data. The survey was open for 30 days, from October 28, 2024 to November 26, 2024, and received 306 responses.
The questions attempted to generate informative responses to advise the Pantry’s future objectives. Specifically, the survey focused on potential expansion methods for the mobile Pantry, assessing students’ familiarity with the Mobile Pantry, their frequency of use, preferred locations and times, and potential barriers to usage such as scheduling conflicts and transportation challenges. Additionally, the survey gathered feedback on the individual's inventory preferences, studied the impact of food insecurity on student’s academic performance and well-being, and explored students’ access to nutritious meals. Demographic information was also obtained for each respondent to better understand how these factors disproportionately affect certain subgroups.
To gauge the efficacy of our survey, we conducted a user testing focus group. We invited four individuals to take a preliminary version of the survey and report their thoughts on the experience, both positive and negative. A key change we implemented from their advice was the addition of visual cues in the form of photos. For those who were somewhat unfamiliar with the Mobile Pantry, the image of it provided additional context. We adjusted our survey to these recommendations and finalized the new version.
To encourage survey participation, respondents were given the opportunity to enter a raffle at the end of the survey for a chance to win one of twenty $5 CoHo gift cards. This incentive aimed to increase engagement and response rates among students.
Survey Recruitment and Marketing
Survey respondents were recruited through a combination of in-person and digital marketing initiatives. Flyers with QR codes linked to the survey were displayed in high-traffic campus areas, including common lecture halls, such as Wellman, Teaching and Learning Complex (TLC), Walker, Young, and the Art Building, as well as popular student spaces like the Student Community Center (SCC) and Memorial Union (MU). A strategic partnership with ASUCD Coffee House (CoHo) allowed for a focused marketing campaign from November 20, 2024, to November 23, 2024. During this time period survey flyers with large QR codes were placed on table tents in conjunction with IRL Researchers tabling to engage students directly. In addition to in-person outreach, the survey was promoted via Instagram through both IRL and The Pantry’s respective accounts, as well as other Center for Student Involvement (CSI)-affiliated student and community organizations.
A focus of the survey recruitment strategy was targeting students who actively utilize The Pantry services. Tabling efforts were conducted primarily at the Satellite Pantry location to directly reach Pantry users. To achieve a diverse distribution of responses, tabling sessions were conducted primarily during morning (10:00 AM) to afternoon (2:00 PM). Additionally, close collaboration with The Pantry Volunteers and the greater Pantry team, enabled an increase in survey responses by encouraging pantry users to complete the survey during check-in and check-out processes.
Data Processing
To ensure data accuracy, survey respondents were omitted from analysis if their completeness of the survey was below 50% or if they finished the survey in less than 60 seconds. Additionally, duplicate responses that contained the same email from an optional respondent email request question for a gift card raffle were removed. After data cleaning, the final dataset consisted of 236 entries, compared to 706 entries in 2022.
For the comparative analysis of food insecurity levels between 2022 and 2024, proportional normalization was applied to account for the significant difference in sample sizes (n = 236 in 2024 vs. n = 706 in 2022). This process involved calculating proportions within each category (e.g., food insecurity status, demographic groups) rather than relying on raw counts. Weighted averages are utilized to ensure that findings were representative of the population and not biased by the larger sample size in 2022. Additionally, academic and mental health impact data were transformed into binary indicators (0 and 1) to simplify and ensure consistent statistical comparisons.
One challenge encountered during analysis was the homogeneity in respondents' gender. A large majority of survey respondents (%) identified as female. The research team acknowledges this limitation, as this overrepresented demographic may skew the results.
Key Findings
Finding #1: The Memorial Union, Silo, and Activities and Recreation Center (ARC) are the most requested non-Student Community Center (SCC) Mobile Pantry locations.
Respondents were asked to report what locations they would most like to see the Mobile Pantry on campus. From 234 responses, the Memorial Union, Silo, and Student Community Center were the most common selections.

The Pantry is already located in the Memorial Union (27.4% of responses), and the Mobile Pantry currently operates from the Student Community Center or SCC (18.8%). The most popular new locations then are the Silo (23.4%) and the Activities and Recreation Center or ARC (12%).
These results indicate that in the UC Davis community, the most desired additional Mobile Pantry location would be the Silo.
Finding #2: Friday and Monday are the most popular days of the week for Mobile Pantry usage.

Respondents were asked which days of the week they would most utilize the Mobile Pantry. From 235 responses, the most popular day of the week is Friday (28.9%), with Monday (22.1%) as the second most popular.
Finding #3: The afternoon (12-4 PM) is the most popular time for the Mobile Pantry.

Respondents were asked to indicate their preference for the Mobile Pantry’s operational hours. 57.8% of 235 respondents prefer afternoons (12-4 PM) over any other time frame. The second most preferred time frame is mornings (8-11 AM), selected by 25.1% of respondents.
Finding #4: Individuals primarily hear about the Mobile Pantry through word of mouth.

Of 173 respondents that indicated that they had heard of the mobile pantry, (62 reported they had not), 46% heard of it through word of mouth, whereas only 20% heard of it through social media, 17.3% through in-person promotion, and 15.6% by passing by the SCC.
Survey responses were predominantly collected through pantry in-person promotion. Therefore, the majority of individuals surveyed were Pantry users. As such, it is notable that only 17.3% had heard about the Mobile Pantry through Pantry in-person promotion. As the Mobile Pantry is more popular among Pantry users rather than non-Pantry users, increasing in-person promotion may be beneficial for overall Mobile Pantry awareness.
Finding #5: Snacks and Fresh Produce are the most requested items people want to see in the Mobile Pantry.
Respondents were asked to select a range of possible types of pantry items they would like to see at the Mobile Pantry. There were 6 types of items provided: Snacks, Fresh Produce, Prepared Food, Canned Goods, Toiletries, and Other with a free response option. Respondents were able to select multiple items.

235 respondents responded to this question. Snacks was the most popular item with 189 (80.4%) respondents selecting it with Fresh Produce following closely behind with 187 selections (79.6%). The least popular options were Canned Goods and Toiletries with 120 (51%) and 112 (47.7%) selections, respectively. 170 (72.3%) respondents selected Prepared Food.
There appears to be a general preference for ready-to-eat foods. However, each item type was selected by at least 50% of respondents, demonstrating that most respondents would respond positively to most types of items. For the Other category, 8 respondents entered a free response answer. They responded that they wanted to see eggs, dairy, ready-to-eat meals, spices, and perishable food in general.
Finding #6: Asian and Hispanic foods are the most requested culturally relevant foods people want to see at the Pantry.
When asked if they had any culturally relevant specific foods at the Pantry, 66 people responded. Many respondents mentioned Asian and Hispanic cuisines, spices, and ingredients such as rice, dry noodles, and tortillas. Additionally, several respondents mentioned wanting more vegetarian options.
Finding #7: Approximately 40% of people who attend the pantry support at least 1 person or more with food from the Pantry or Mobile Pantry.
Respondents were asked how many additional people they support with food from the Pantry or the Mobile Pantry. The options were: myself only, 1 person, 2 people, 3 people, and 4+ people.

228 respondents answered this question. 137 people (60.1%) selected that they support themselves only. 91 (39.9%) respondents selected that they support one additional person or more.
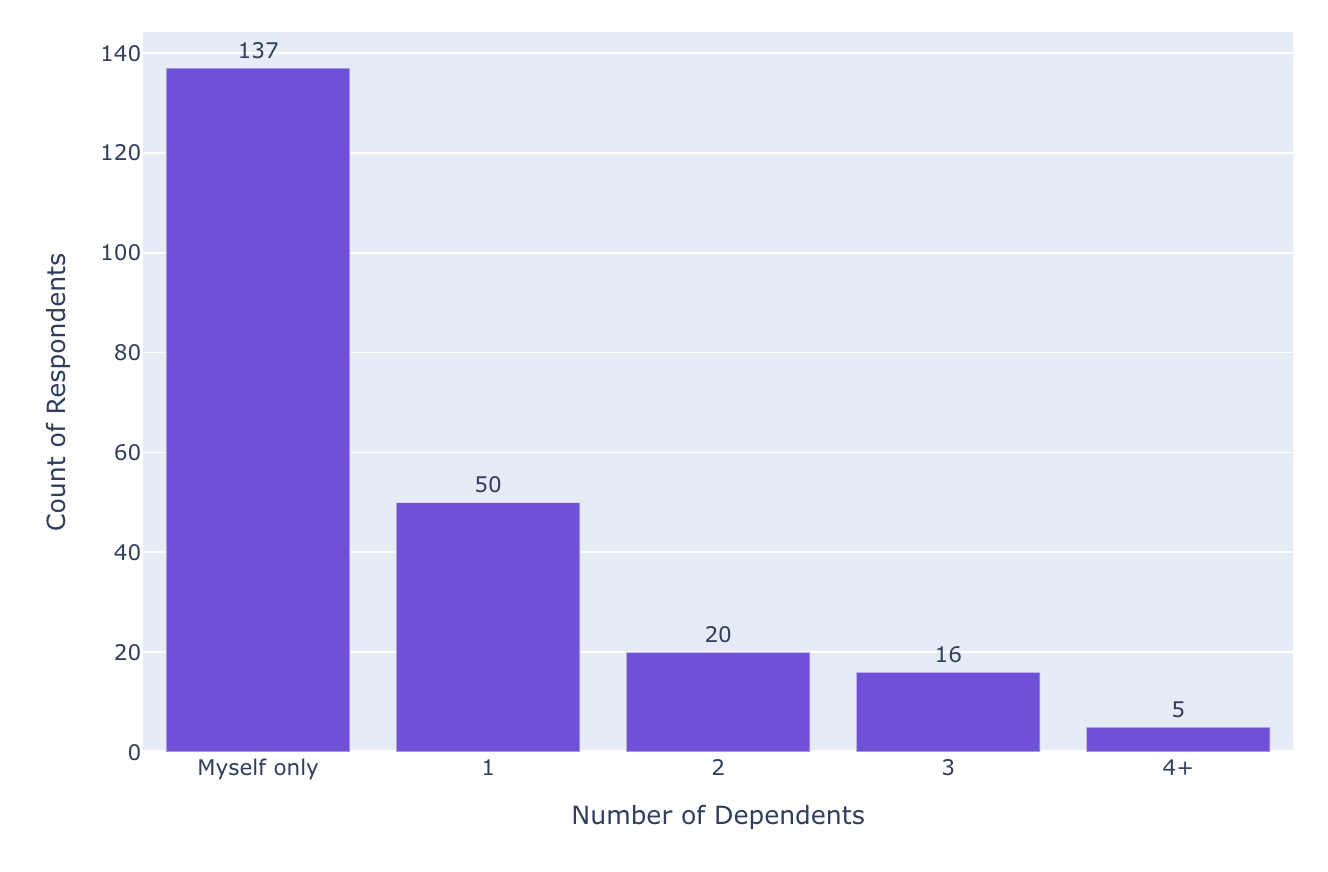
Of the 91 respondents who selected that they support at least one additional person, 50 of them have one dependent, which is 21.9% of all respondents to this question and 54.9% of respondents who have at least 1 dependent. 20 (8.8% of all, 22% of respondents with dependents) respondents have 2 dependents, 16 (7% of all, 17.6% of respondents with dependents) respondents have 3 dependents, and 5 (2.2% of all, 5.5% of respondents with dependents) respondents have at least 4 dependents.
Finding #8: Food insecurity increased from 1 in 4 students in 2022 to 1 in 3 students in 2024.
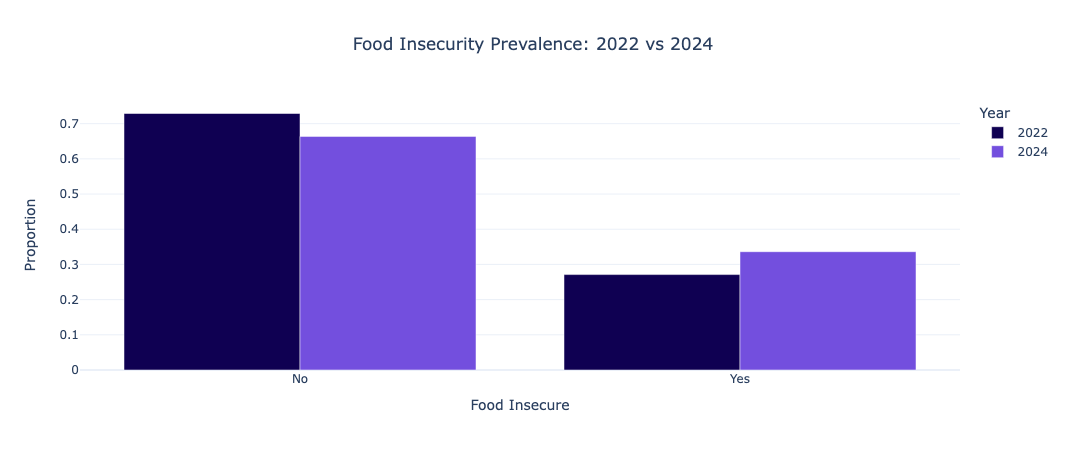
There has been a notable increase in food insecurity among respondents over the past two years. In 2022, 170 out of 706, or 24.08% of respondents reported experiencing food insecurity, which translates to approximately 1 in 4 students. By 2024, this percentage increased to 33.47%, or 70 out of 236 respondents. Now, 1 in 3 students face food insecurity.
Finding #9: The mental health impact of food insecurity remains high.
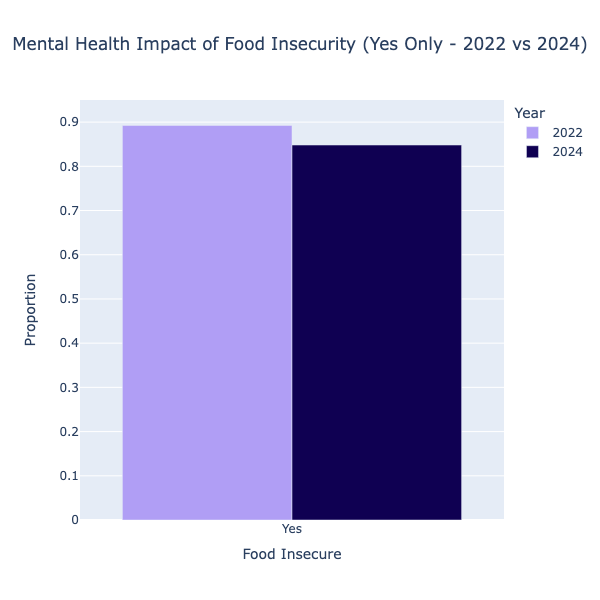
Respondents who selected that they experienced food insecurity were asked if food insecurity has negatively impacted their mental health. Food insecurity continues to have a significant impact on student’s mental health, with a slight decrease observed in students who selected Yes between 2022 and 2024. In 2022, 630 out of 706 food insecure respondents, or 89.24% reported experiencing mental health challenges, compared to 200 out of 236 respondents, or 84.81% in 2024.
Finding #10: Food insecurity negatively impacts academic performance.

Food insecurity continues to significantly impact students’ academic performance, with a slight increase in respondents selecting that food insecurity has negatively impacted their academic performance observed between 2022 and 2024. In 2022, 491 out of 706 food insecure respondents, or 69.62% reported experiencing academic challenges due to food insecurity. In 2024, this figure increased to 170 out of 236 respondents, or 72.15%
Finding #11: Food insecurity varies by class standing, with notable increases among freshmen and juniors from 2022 to 2024.

Food insecurity among UC Davis students shows variation based on class standing, with an upward trend observed in specific groups between 2022 and 2024. In 2022, food insecurity prevalence among freshmen was 20.29%, with 8 out of 37 respondents reporting food insecurity. This figure increased to 35.14% in 2024, with 13 out of 37 respondents indicating food insecurity. Among juniors, the percentage of students experiencing food insecurity rose from 28.10% (18 out of 63 respondents) in 2022 to 33.33% (21 out of 63 respondents) in 2024.
Seniors saw a slight decrease in food insecurity levels, dropping from 34.13% in 2022 to 31.37% in 2024. Sophomores also experienced a marginal decline, with food insecurity rates decreasing from 29.06% in 2022 to 27.78% in 2024. Due to insufficient data, responses from fifth-year+ students and the "Other" category were not included in the analysis.
It is noted that because the sample size of respondents who are food insecure is relatively small (n = 79).
Finding #12: Food insecurity rates in 2024 were relatively consistent across male and female gender groups.

Among female respondents, 34.16% (55 out of 161) reported experiencing food insecurity, while 65.84% (106 respondents) did not. Male respondents reported a similar food insecurity rate of 33.33%, with 19 out of 57 experiencing food insecurity and 38 respondents (66.67%) not experiencing food insecurity.
Non-binary respondents reported a lower food insecurity rate of 25.00%, with 2 out of 8 respondents indicating food insecurity and 75.00% (6 respondents) reporting food security. Similarly, individuals who identified as "Other" experienced a food insecurity rate of 33.33%, with 1 out of 3 respondents reporting food insecurity and 66.67% (2 respondents) not experiencing food insecurity.
The smaller sample sizes for non-binary and "Other" respondents should be considered when interpreting these results.
Finding #13: Food insecurity rates in 2024 varied across racial groups.

Among Asian respondents, 28.79% (38 out of 132) reported experiencing food insecurity, while 71.21% (94 respondents) did not. White respondents experienced a higher food insecurity rate of 37.25%, with 19 out of 51 respondents indicating food insecurity and 62.75% (32 respondents) reporting food security.
Individuals identifying as "Other" reported the highest food insecurity rate at 42.86%, with 9 out of 21 respondents experiencing food insecurity and 57.14% (12 respondents) not experiencing food insecurity. Based on self-reported descriptions within this category, several respondents identified as Middle Eastern, suggesting potential disparities within this demographic.
Similarly, respondents identifying as having two or more races reported a food insecurity rate of 41.67%, with 5 out of 12 respondents experiencing food insecurity and 58.33% (7 respondents) not experiencing food insecurity.
Data for American Indian or Alaskan Native and Black or African American respondents were insufficient for analysis. The limited sample sizes for racial groups should be considered when interpreting these findings.
Conclusion & Recommendations
The findings indicate an increasing demand for accessible food resources, along with consumers preferring convenient, ready-to-eat, and culturally relevant food items. Food insecurity remains a critical issue in the UC Davis student population, with one in three students facing challenges in accessing nutritious meals, which can significantly impact their academic performance and mental well-being. Additionally, demographic analysis highlights disparities in food insecurity across identifying groups.
The following recommendations are proposed to optimize the Mobile Pantry Operations and address food insecurity more effectively across the UC Davis campus:
Mobile Pantry Operations
- Expand operational hours. Run the mobile pantry on Monday and Friday afternoons (12:00 PM - 4:00 PM), as these were identified as the most preferred days and times by students.
- Optimize location accessibility. While continuing services at the Student Community Center (SCC), mobile Pantry locations identified as high-demand areas for possible expansion are the Silo and the Activities and Recreation Center (ARC).
- Increase in-person promotion. To improve awareness surrounding the Mobile Pantry, promote advertisements through Pantry in-person promotions.
- Focus on providing ready-to-eat foods and culturally relevant spices and pantry staples. Respondents were the most interested in snacks, produce, and prepared food. People seem to gravitate towards ready-to-eat food. However, when asked about culturally relevant foods, respondents wanted to see more Hispanic and Asian produce and ingredients such as noodles, tofu, and spices.
Addressing Food Insecurity
- Targeted support for high-risk student groups. Develop and partner with cultural and resource programs to provide tailored support for students at higher risk of food insecurity, such as freshmen, juniors, and underrepresented demographic groups.
- Mental health and academic support initiatives. Collaborate with campus wellness programs to provide mental health resources to students impacted by food insecurity. Support services are encouraged to help students manage academic challenges related to food insecurity.
- Financial assistance and food access programs. Increase awareness and enrollment efforts for programs such as CalFresh, Aggie Compass, and Aggie Meal Share, which provide food assistance and financial support. Additionally, funding to expand Pantry services can better meet the growing demand.
Appendix
Appendix A: Survey Questions
- How did you hear about the Mobile Pantry?
- Word of mouth
- Social media (Instagram, etc.)
- Passing by the Student Community Center
- Pantry in-person promotion
- I have not heard about the Mobile Pantry
- How do you utilize the Pantry resources?
- I use both the Pantry and the Mobile Pantry
- I only use the Pantry
- I only use the Mobile Pantry
- I do not use the Pantry or Mobile Pantry
- How often do you utilize the Mobile Pantry?
- Daily
- Weekly
- Monthly
- Less than monthly
- Never
- Where would you like to see the Mobile Pantry on campus? (Check all that apply)
- Silo
- Memorial Union
- Dorms / Dining Halls
- ARC
- Football Stadium
- Student Community Center
- None of the above
- Which day would you most utilize the Mobile Pantry?
- Monday
- Tuesday
- Wednesday
- Thursday
- Friday
- What time of day would you most utilize the Mobile Pantry?
- Morning (8-11 AM)
- Afternoon (12 - 4 PM)
- Evening (5 - 7 PM)
- Night (7 - 9 PM)
- What items would you like to see at the Mobile Pantry? (Check all that apply)
- Snacks
- Canned goods
- Fresh Produce (Fruits, vegetables, etc.)
- Prepared Food (Instant Noodles, Frozen Meals, etc.)
- Toiletries (Soap, Condoms, Menstrual Products, etc.)
- Other:
- Which circumstances apply to you? (Check all that apply)
- I am usually able to access and transport food from the Mobile Pantry
- I have trouble able to get food because of scheduling conflicts
- I have trouble transporting the food home / around campus
- I do not use the Mobile Pantry
- What transportation methods do you use to get to and from campus? (Check all that apply)
- Bike/Scooter
- Bus
- Car
- Walk
- Other: Specify
Food Insecurity
Food Insecurity Definition: Food insecurity is defined as not having at all times, physical, social, and economic access to sufficient, safe, and nutritious food that meets personal food preferences and dietary needs for an active and healthy life.
- At any point during the last 12 months, have you ever experienced food insecurity where you did not know where your next meal will come from, or had to involuntarily eat less than you need on a regular basis due to not being able to afford enough food?
- Yes
- No
Food Insecurity Prevalence and Impact Questions
- How often do you have access to nutritious meals that enable you to pursue both your academic and professional goals to the fullest extent?
- Always (6-7 times a week)
- Usually (4-5 times a week)
- Sometimes (2-3 times a week)
- Rarely (once a week)
- Never
- Has experiencing food insecurity negatively affected your academic performance?
- Yes
- No
- .Has experiencing food insecurity negatively affected your physical or mental health?
- Yes
- No
- Which of the following resources for food accessibility are you aware of? (Check all that apply)
- ASUCD Pantry
- AB540 and Undocumented Student Center
- Aggie Compass Food Programs
- Aggie Meal Share Program
- St. Tabitha's Essentials Pantry (located at the Belfry church)
- Cal Fresh
- Fruit and Veggie Up!
- Queer Trans Mini Pantry (LGBTQIA Center)
- Solano Park Pantry
- Other: Specify
Optional Questions
- What year are you?
- Freshman
- Sophomore
- Junior
- Senior
- 5th year+
- Are you a transfer student?
- Yes
- No
- What is your employment status?
- Full-time
- Part-time
- Unemployed
- How many additional people do you support with the food from the Pantry or Mobile Pantry? (Roommates, family members, etc.)
- Myself only
- 1
- 2
- 3
- 4+
- Are there any specific, culturally relevant foods you would like to see available at the pantry?
- Short answer
Appendix B: Survey Figures

References
ASUCD Pantry (Ed.). (2024, December 18). Mobile Pantry. The Pantry. https://thepantry.ucdavis.edu/mobile-pantry
ASUCD Pantry (Ed.). (n.d.). The pantry. The Pantry. https://thepantry.ucdavis.edu/
ASUCD Pantry. (2023). The pantry zine. The Pantry.
Narwal, J., Fujimoto, S., Moon, M., Muench, A., Lamba, A., & Duggal, V. (2022). (rep.). Food Insecurity among UC Davis Students and Barriers to the ASUCD Pantry. Davis, CA: ASUCD Research and Data Committee.